{"value":"You use map apps every day to find your favorite restaurant or travel the fastest route using geospatial data. There are two types of geospatial data: vector data that uses two-dimensional geometries such as a building location (points), roads (lines), or land boundary (polygons), and raster data such as satellite and aerial images.\n\nLast year, we introduced [Amazon Location Service](https://aws.amazon.com/blogs/aws/amazon-location-service-is-now-generally-available-with-new-routing-and-satellite-imagery-capabilities/), which makes it easy for developers to add location functionality to their applications. With [Amazon Location Service](https://aws.amazon.com/cn/location/?trk=cndc-detail), you can visualize a map, search points of interest, optimize delivery routes, track assets, and use geofencing to detect entry and exit events in your defined geographical boundary.\n\n\n\nHowever, if you want to make predictions from geospatial data using machine learning (ML), there are lots of challenges. When I studied geographic information systems (GIS) in graduate school, I was limited to a small data set that covered only a narrow area and had to contend with limited storage and only the computing power of my laptop at the time.\n\nThese challenges include 1) acquiring and accessing high-quality geospatial datasets is complex as it requires working with multiple data sources and vendors, 2) preparing massive geospatial data for training and inference can be time-consuming and expensive, and 3) specialized tools are needed to visualize geospatial data and integrate with ML operation infrastructure\n\nToday I’m excited to announce the preview release of [Amazon SageMaker‘s new geospatial capabilities](https://aws.amazon.com/sagemaker/geospatial/) that make it easy to build, train, and deploy ML models using geospatial data. This collection of features offers pre-trained deep neural network (DNN) models and geospatial operators that make it easy to access and prepare large geospatial datasets. All generated predictions can be visualized and explored on the map.\n\nAlso, you can use the new geospatial image to transform and visualize data inside geospatial notebooks using open-source libraries such as [NumPy](https://numpy.org/), [GDAL](https://gdal.org/), [GeoPandas](https://geopandas.org/), and [Rasterio](https://rasterio.readthedocs.io/en/latest/), as well as SageMaker-specific libraries.\n\nWith a few clicks in the [SageMaker Studio](https://aws.amazon.com/sagemaker/studio) console, a fully integrated development environment (IDE) for ML, you can run an Earth Observation job, such as a land cover segmentation or launch notebooks. You can bring various geospatial data, for example, your own Planet Labs satellite data from [Amazon S3](https://aws.amazon.com/s3), or [US Geological Survey LANDSAT](https://registry.opendata.aws/usgs-landsat/) and [Sentinel-2 ](https://registry.opendata.aws/sentinel-2-l2a-cogs)images from [Open Data on AWS](https://registry.opendata.aws/?search=tags:gis,earth%20observation,events,mapping,meteorological,environmental,transportation), [Amazon Location Service](https://aws.amazon.com/cn/location/?trk=cndc-detail), or bring your own data, such as location data generated from GPS devices, connected vehicles or internet of things (IoT) sensors, retail store foot traffic, geo-marketing and census data.\n\nThe [Amazon SageMaker](https://aws.amazon.com/cn/sagemaker/?trk=cndc-detail) geospatial capabilities support use cases across any industry. For example, insurance companies can use satellite images to analyze the damage impact from natural disasters on local economies, and agriculture companies can track the health of crops, predict harvest yield, and forecast regional demand for agricultural produce. Retailers can combine location and map data with competitive intelligence to optimize new store locations worldwide. These are just a few of the example use cases. You can turn your own ideas into reality!\n\n**++Introducing [Amazon SageMaker](https://aws.amazon.com/cn/sagemaker/?trk=cndc-detail) Geospatial Capabilities++**\n\nIn the preview, you can use SageMaker Studio initialized in the US West (Oregon) Region. Make sure to set the default Jupyter Lab 3 as the version when you create a new user in the Studio. To learn more about setting up SageMaker Studio, see [Onboard to Amazon SageMaker Domain Using Quick setup](https://docs.aws.amazon.com/sagemaker/latest/dg/onboard-quick-start.html) in the AWS documentation.\n\nNow you can find the **Geospatial** section by navigating to the homepage and scrolling down in SageMaker Studio’s new **Launcher** tab.\n\n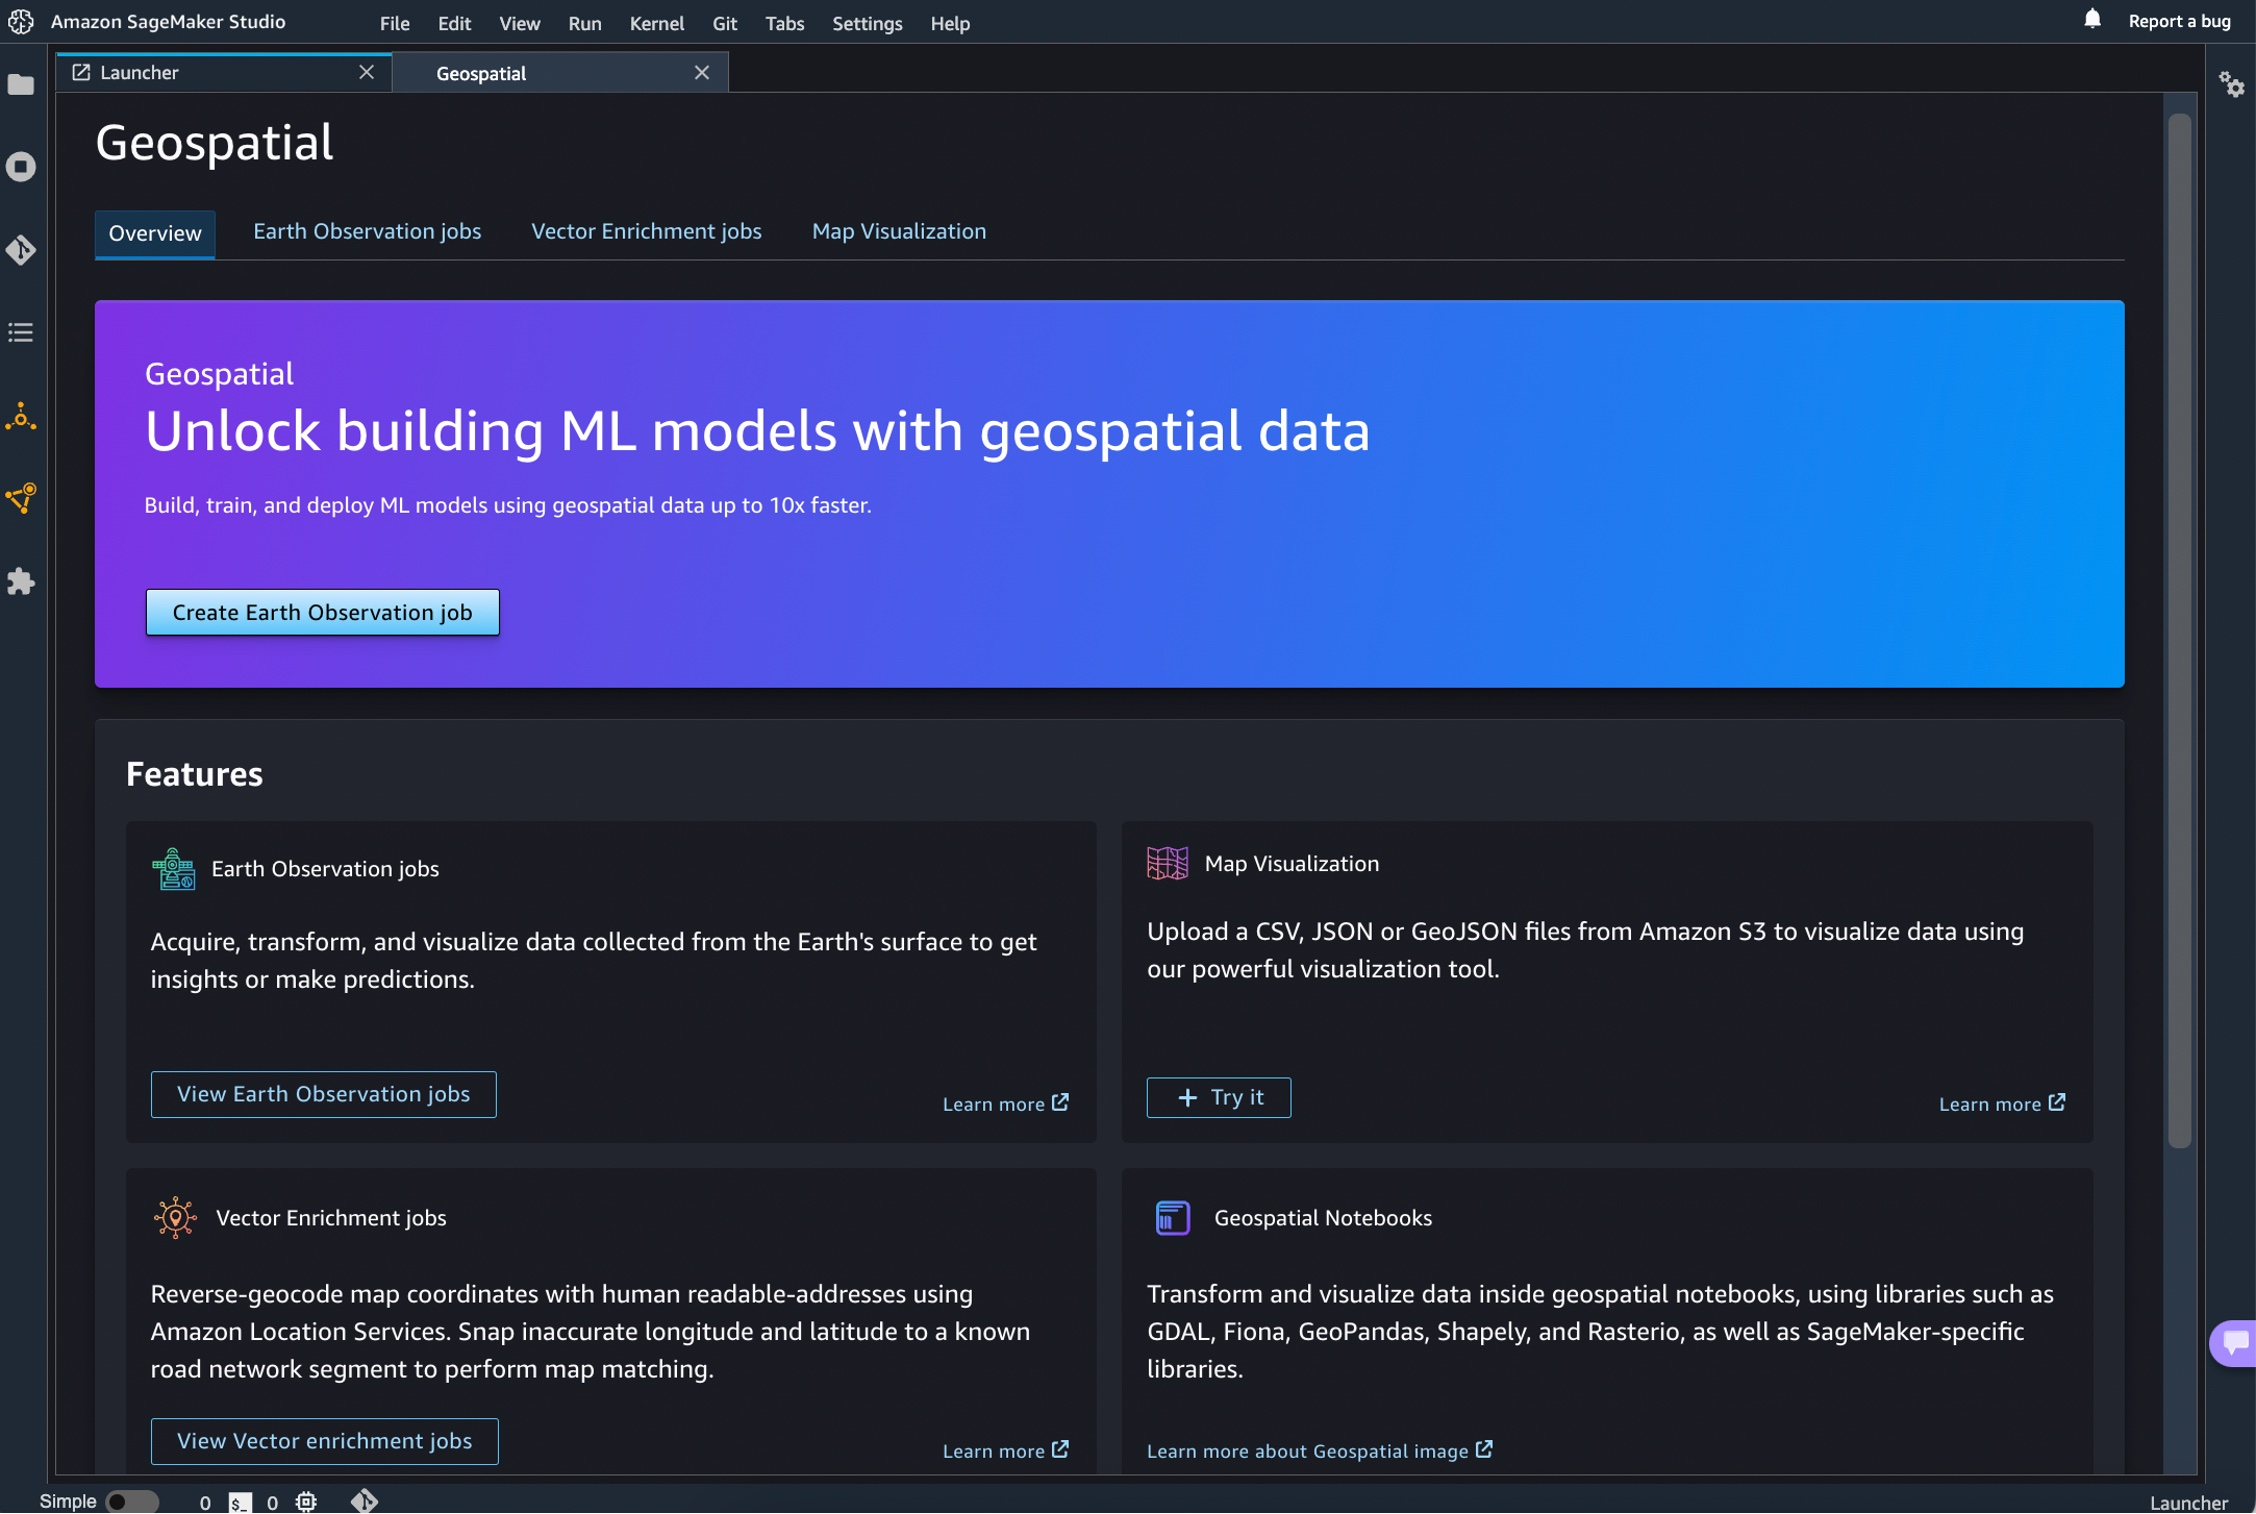\n\nHere is an overview of three key [Amazon SageMaker](https://aws.amazon.com/cn/sagemaker/?trk=cndc-detail) geospatial capabilities:\n\n- **Earth Observation jobs** – Acquire, transform, and visualize satellite imagery data to make predictions and get useful insights.\n- **Vector Enrichment jobs** – Enrich your data with operations, such as converting geographical coordinates to readable addresses from CSV files.\n- **Map Visualization** – Visualize satellite images or map data uploaded from a CSV, JSON, or GeoJSON file.\n\nLet’s dive deep into each component!\n\n**++Get Started with an Earth Observation Job++**\n\nTo get started with Earth Observation jobs, select **Create Earth Observation job** on the front page.\n\n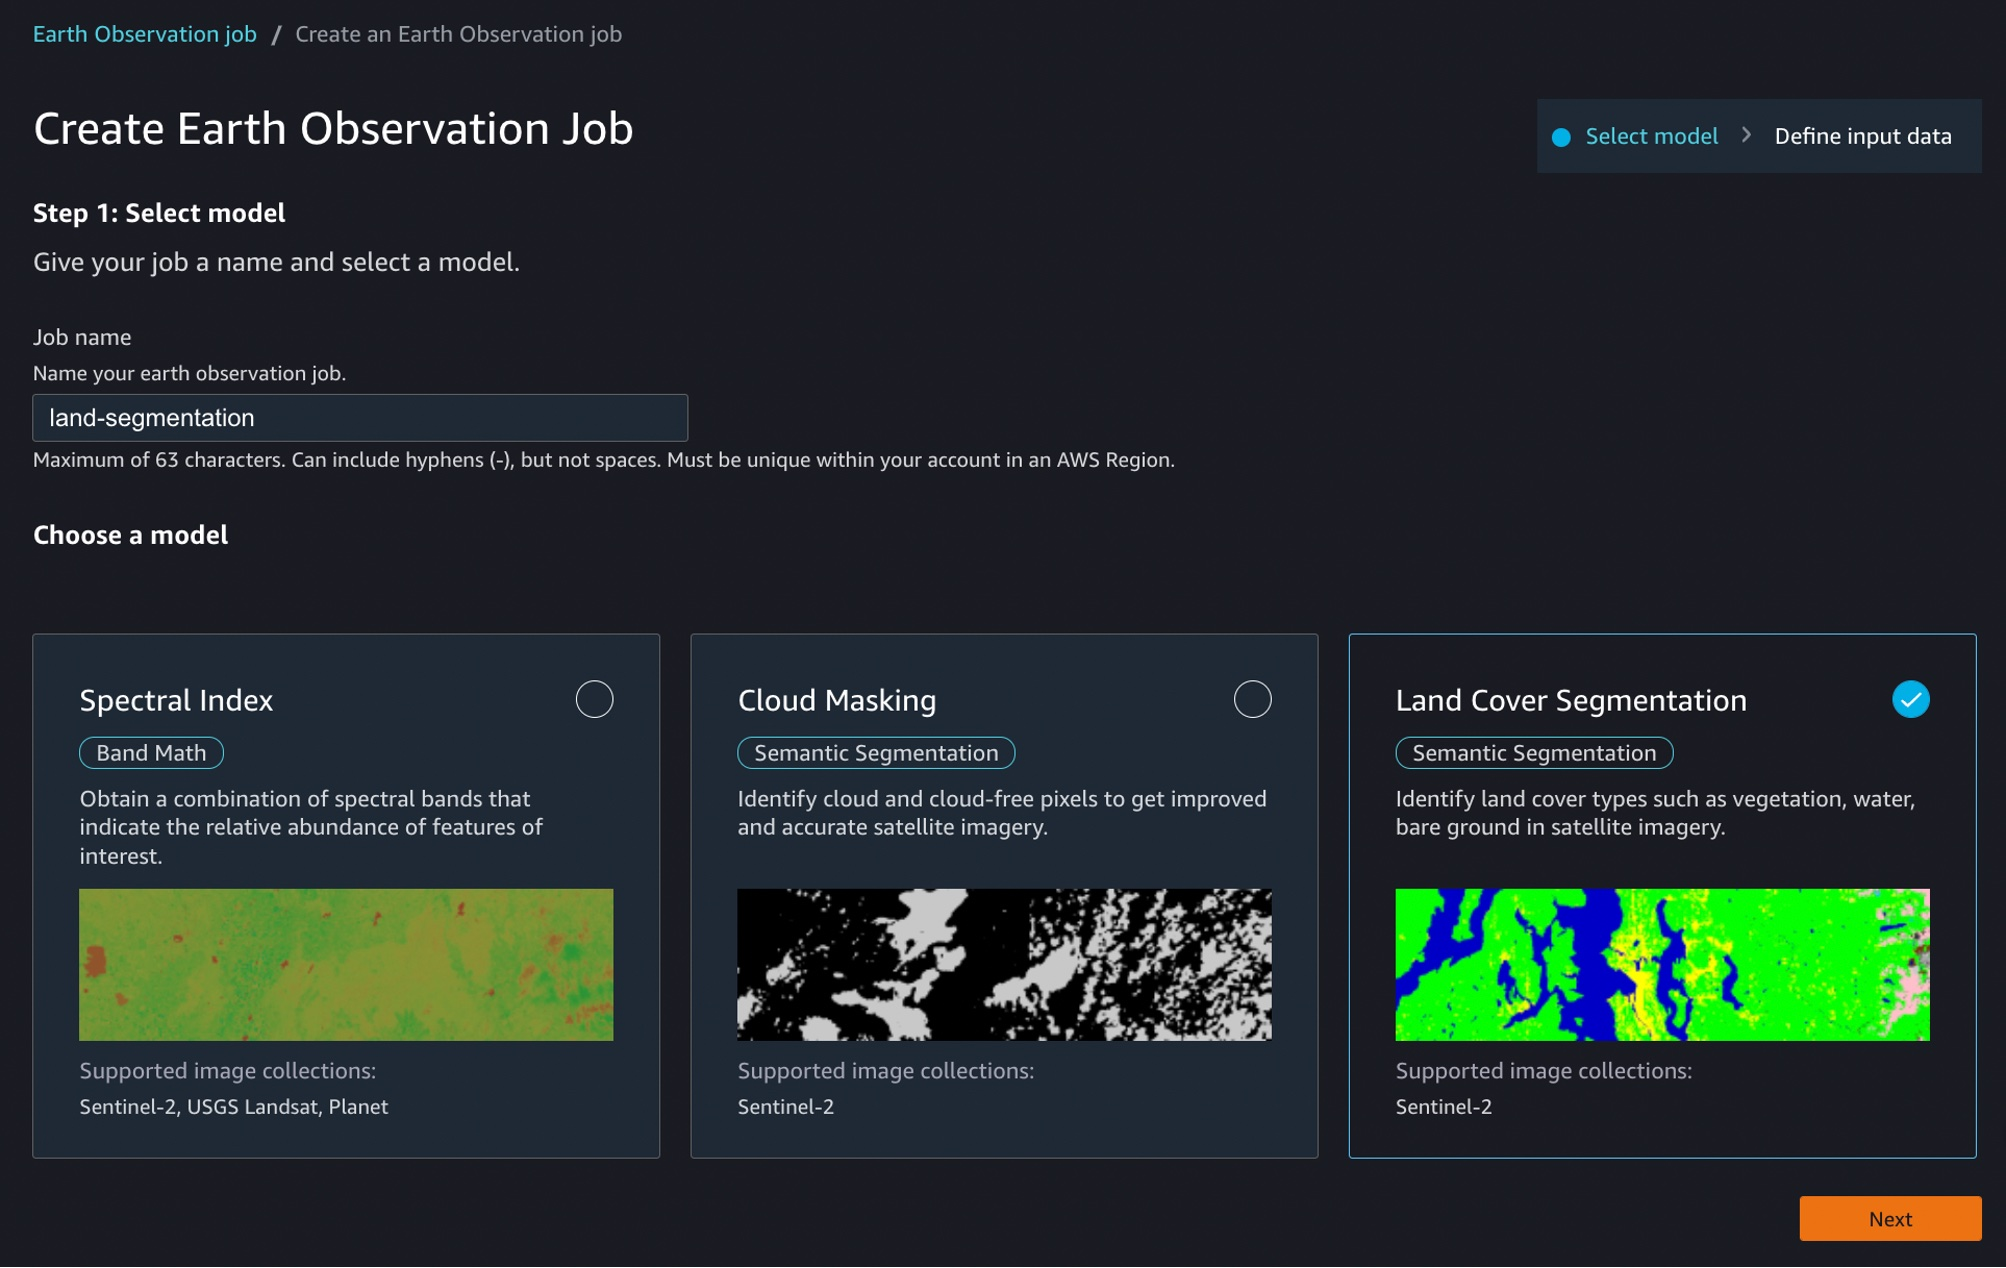\n\nYou can select one of the geospatial operations or ML models based on your use case.\n\n- **Spectral Index** – Obtain a combination of spectral bands that indicate the abundance of features of interest.\n- **Cloud Masking** – Identify cloud and cloud-free pixels to get clear and accurate satellite imagery.\n- **Land Cover Segmentation** – Identify land cover types such as vegetation and water in satellite imagery.\n\nThe SageMaker provides a combination of geospatial functionalities that include built-in operations for data transformations along with pretrained ML models. You can use these models to understand the impact of environmental changes and human activities over time, identify cloud and cloud-free pixels, and perform semantic segmentation.\n\nDefine a **Job name**, choose a model to be used, and click the bottom-right **Next** button to move to the second configuration step.\n\nNext, you can define an area of interest (AOI), the satellite image data set you want to use, and filters for your job. The left screen shows the **Area of Interest** map to visualize for your **Earth Observation Job** selection, and the right screen contains satellite images and filter options for your AOI.\n\n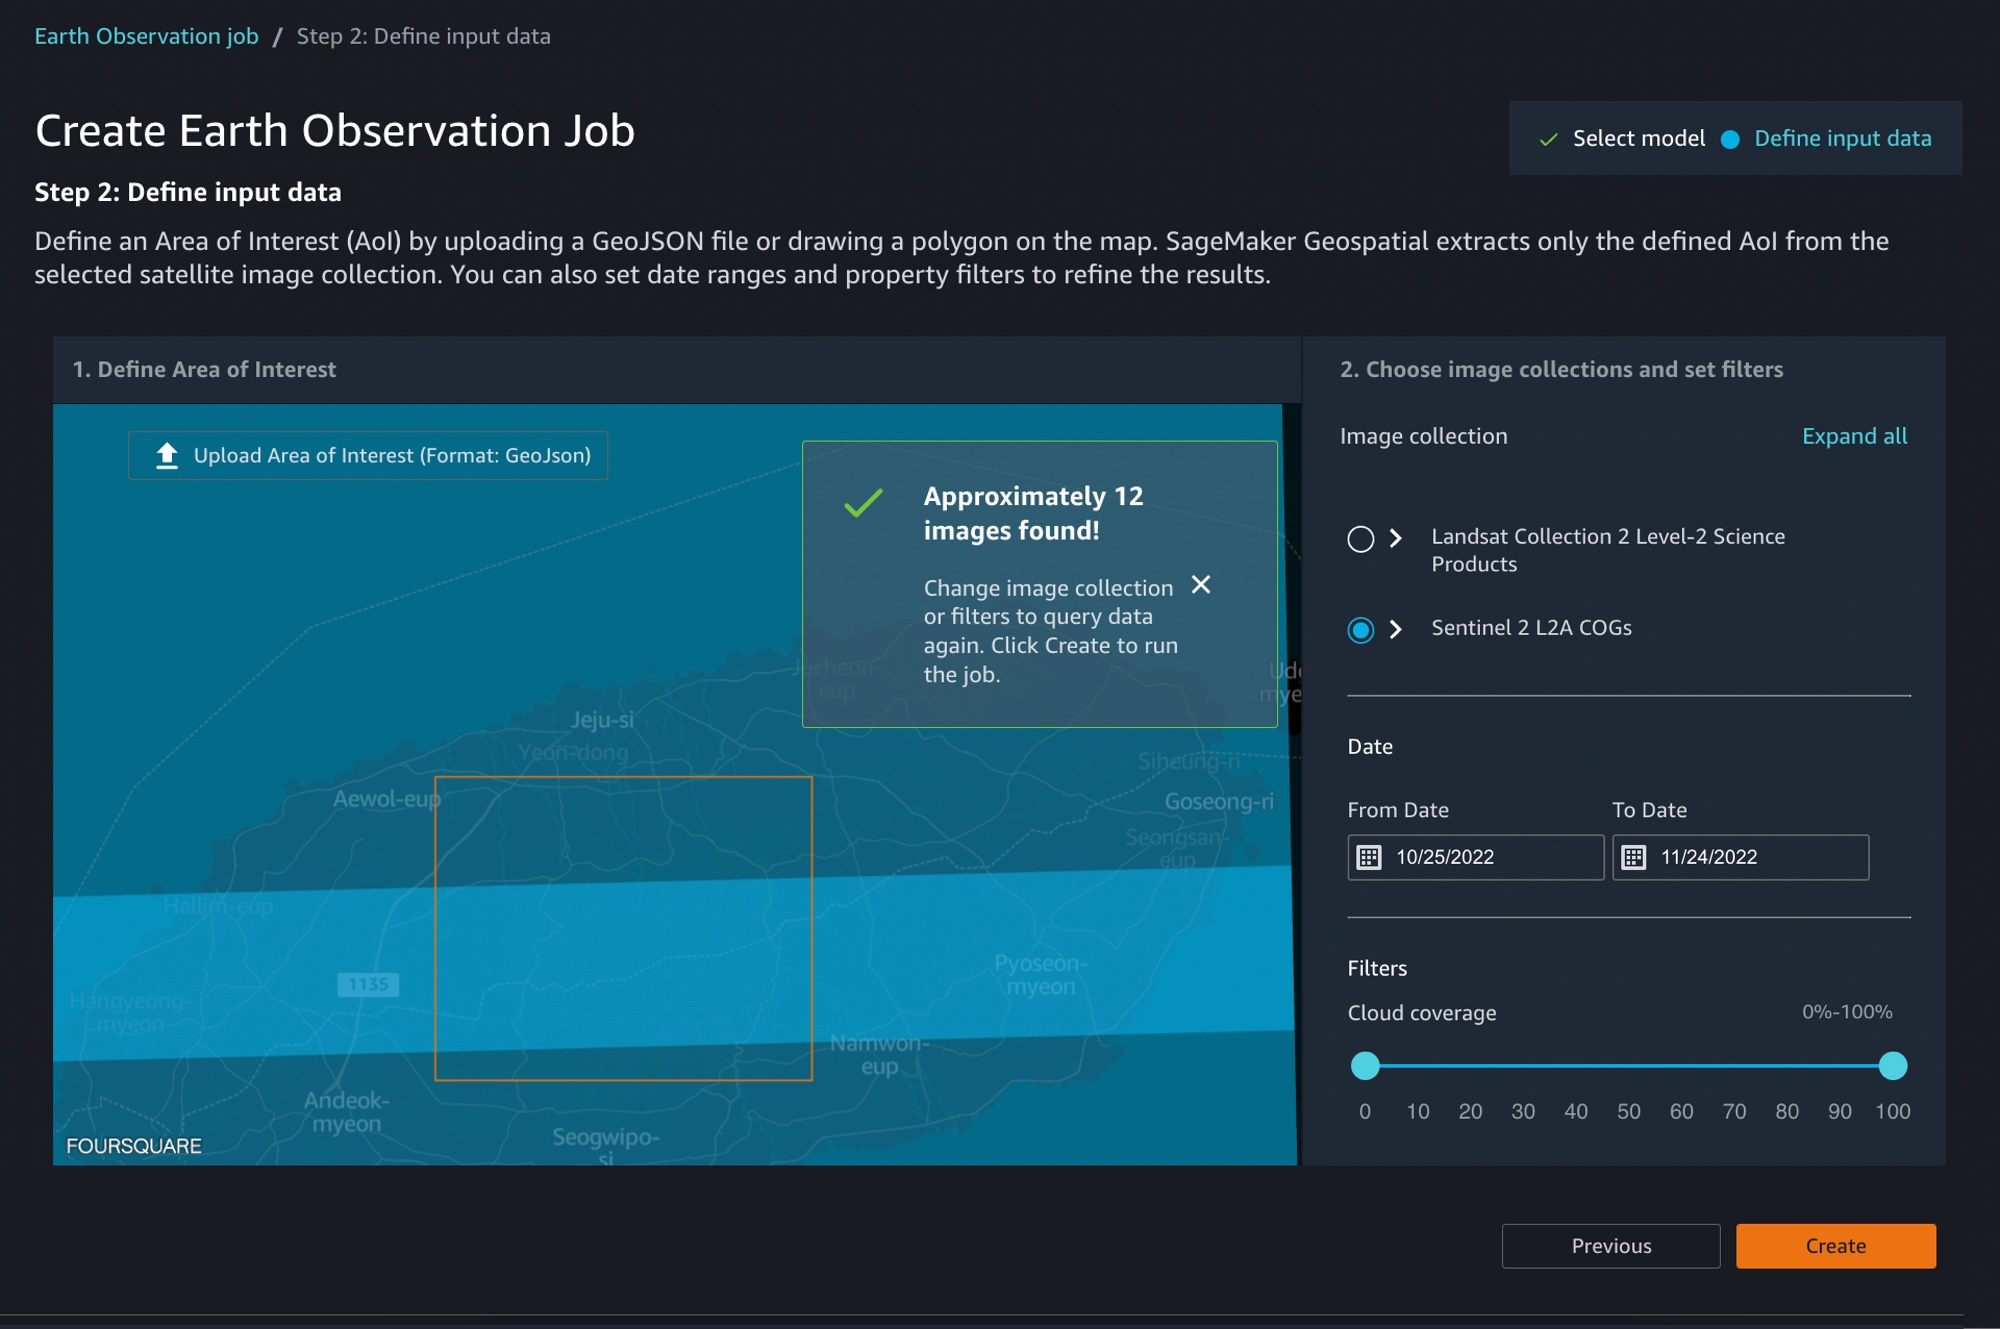\n\nYou can choose the satellite image collection, either USGS LANDSAT or Sentinel-2 images, the date span for your Earth Observation job, and filters on properties of your images in the filter section.\n\nI uploaded GeoJSON format to define my AOI as the [Mountain Halla ](https://en.wikipedia.org/wiki/Hallasan)area in [Jeju island](https://en.wikipedia.org/wiki/Jeju_Island), South Korea. I select all job properties and options and choose **Create**.\n\nOnce the Earth Observation job is successfully created, a flashbar will appear where I can view my job details by pressing the **View job details** button.\n\n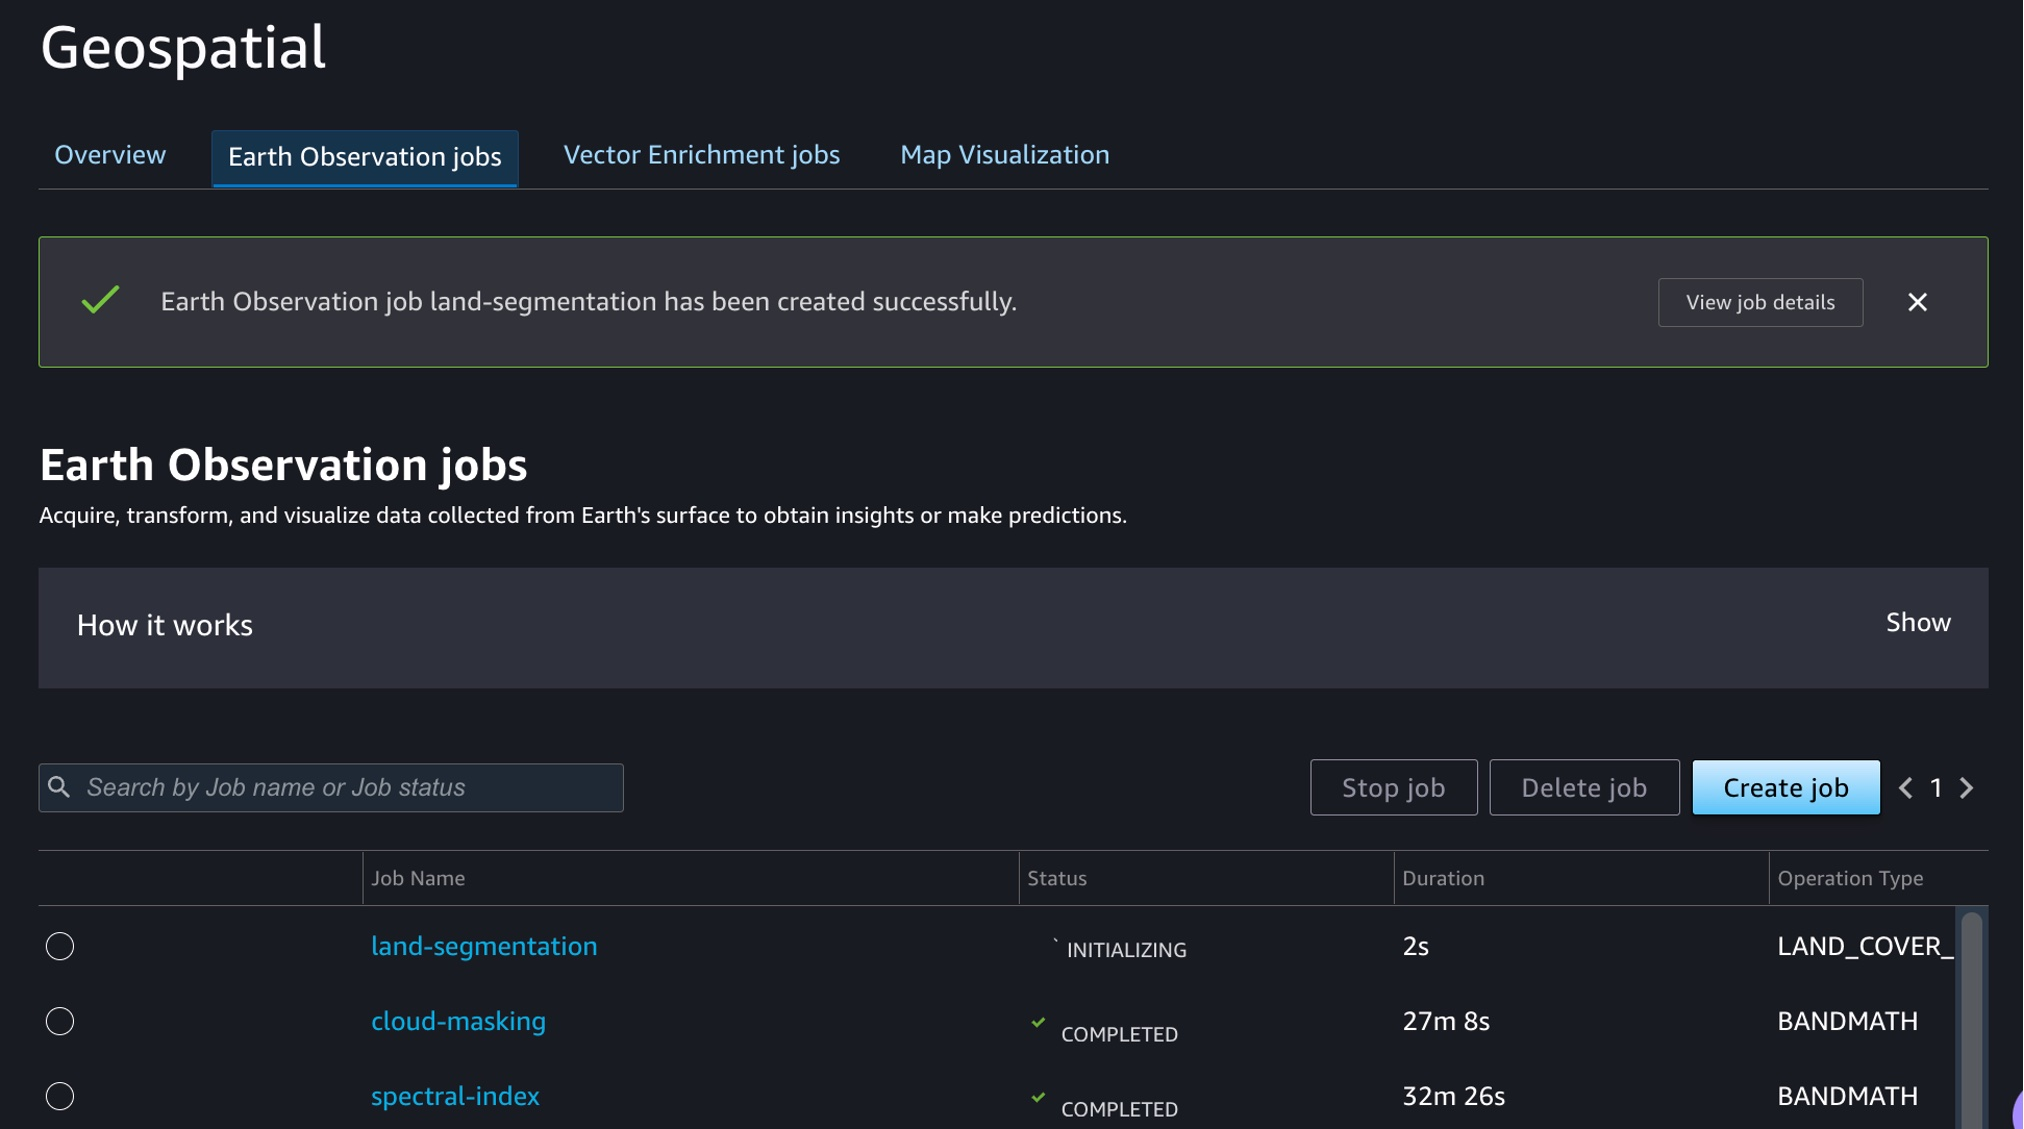\n\nOnce the job is finished, I can **Visualize job output**.\n\n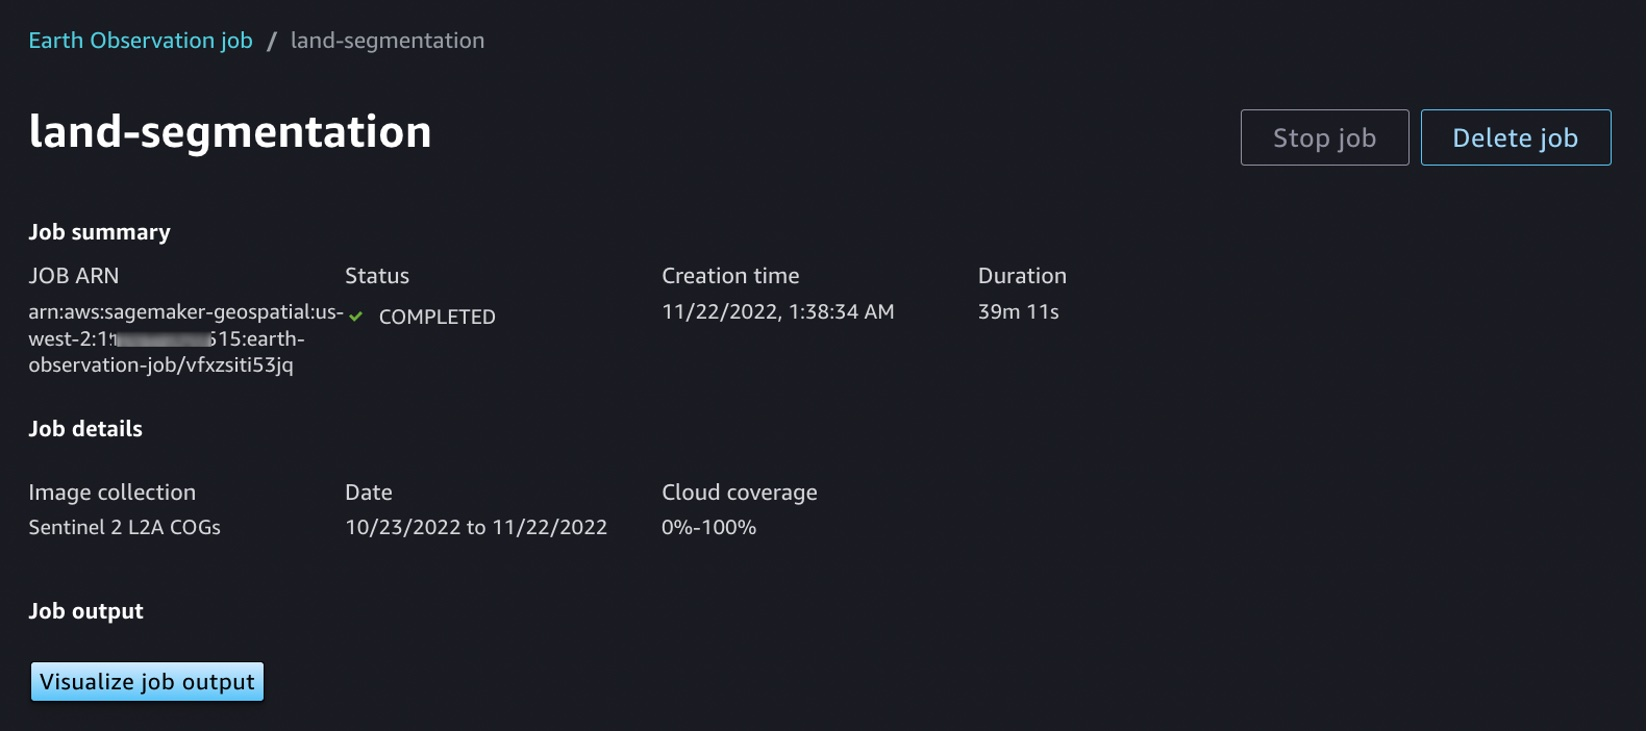\n\nThis image is a job output on rendering process to detect land usage from input satellite images. You can see either input images, output images, or the AOI from data layers in the left pane.\n\nIt shows automatic mapping results of land cover for natural resource management. For example, the yellow area is the sea, green is cloud, dark orange is forest, and orange is land.\n\n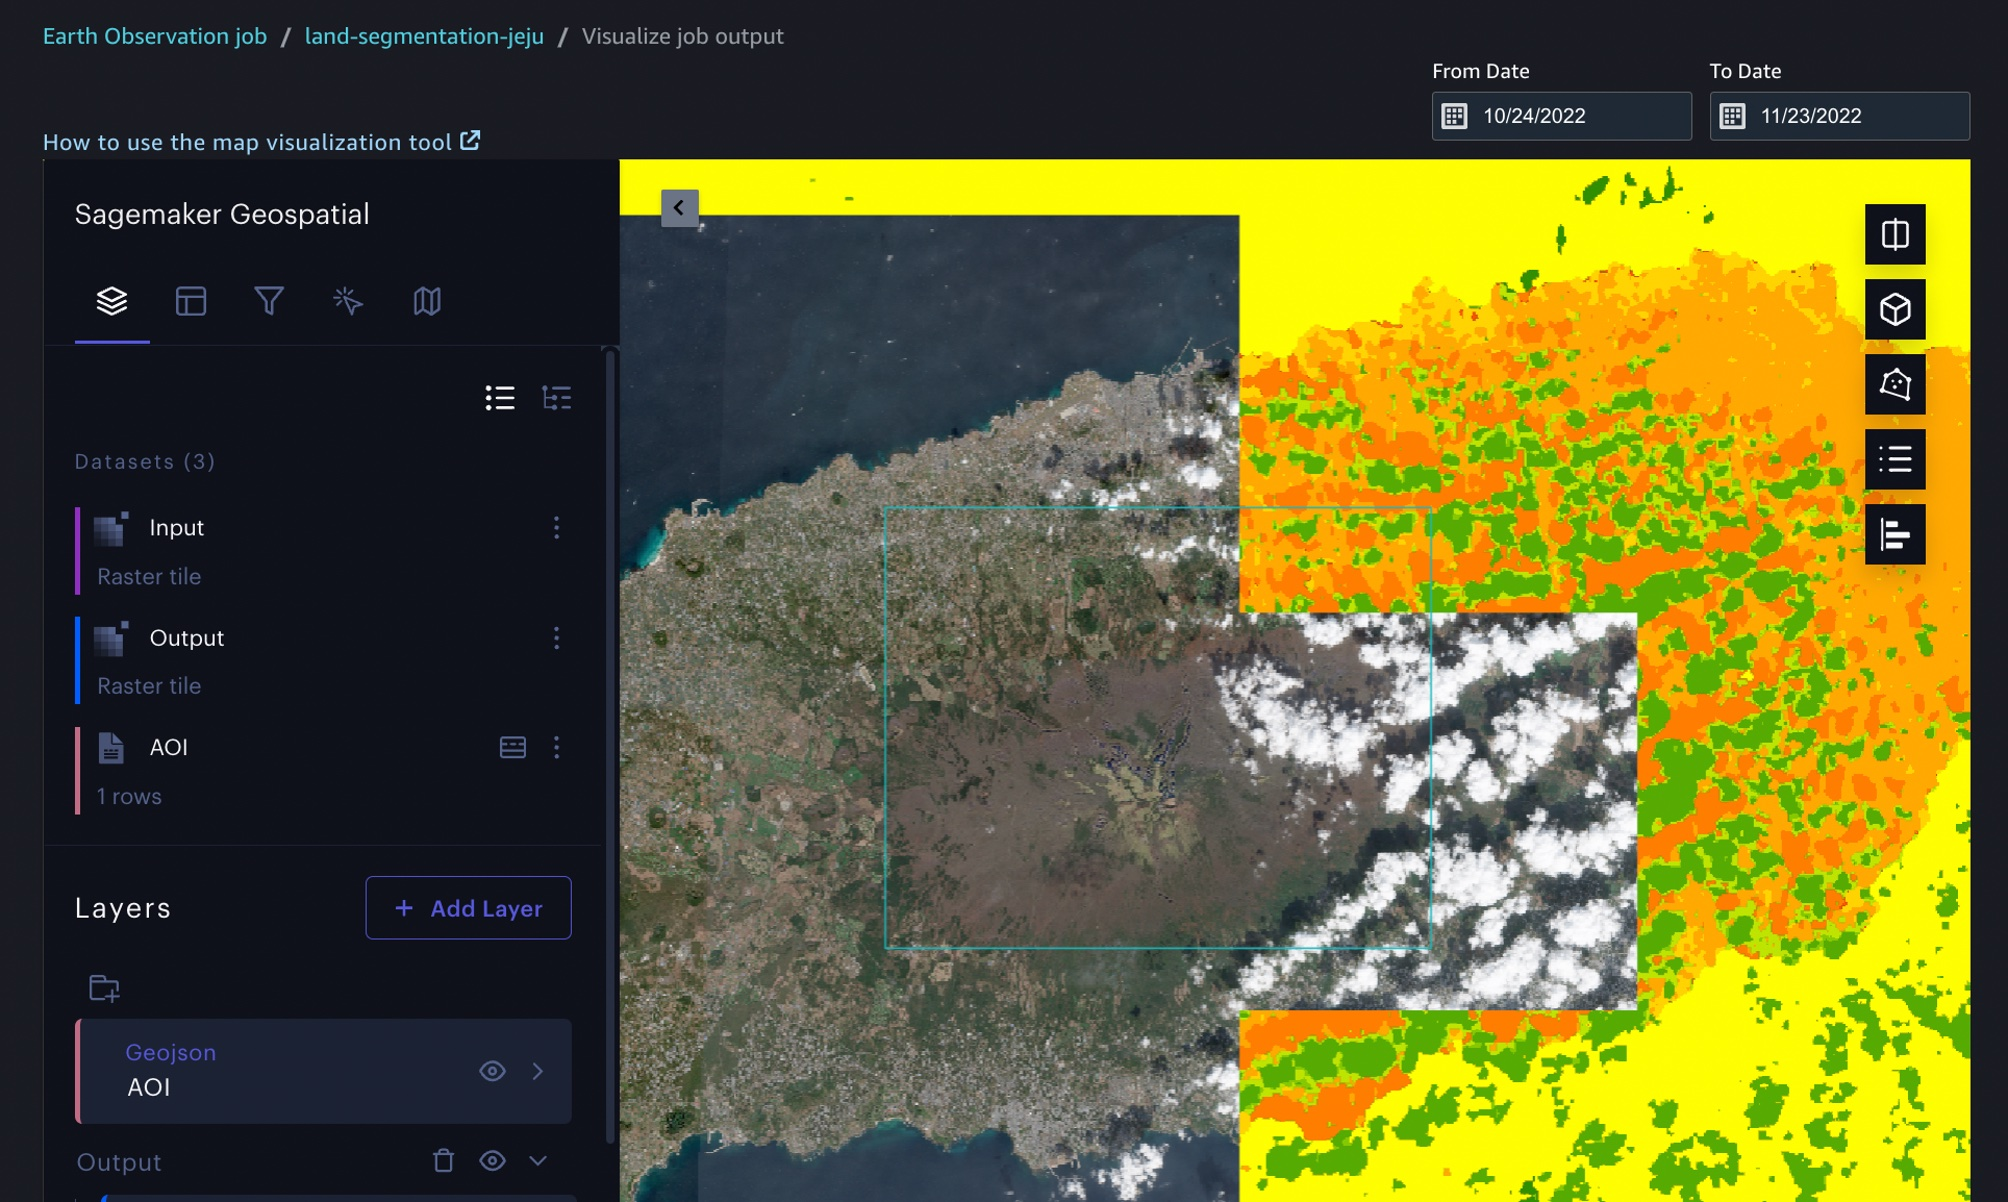\n\nYou can also execute the same job with SageMaker notebook using the geospatial image with geospatial SDKs.\n\nFrom the **File** and **New**, choose **Notebook** and select the **Image** dropdown menu in the **Setup notebook environment** and choose **Geospatial 1.0**. Let the other settings be set to the default values.\n\n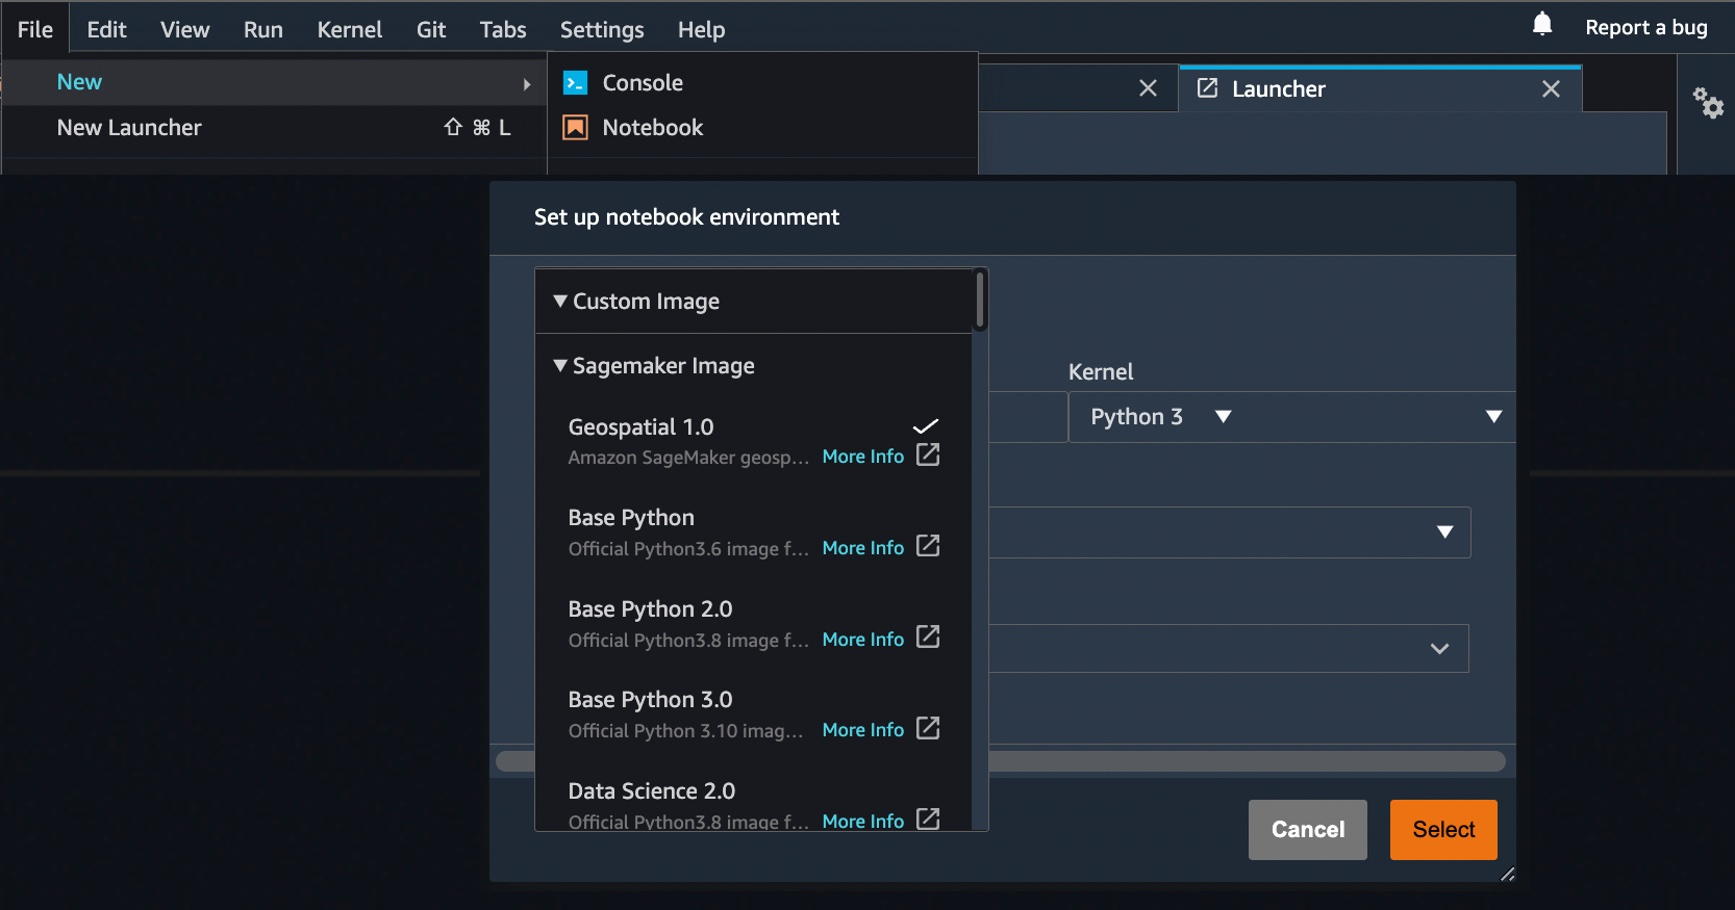\n\nLet’s look at Python sample code! First, set up SageMaker geospatial libraries.\n\nPython\n\n```\\nimport boto3\\nimport botocore\\nimport sagemaker\\nimport sagemaker_geospatial_map\\n\\nregion = boto3.Session().region_name\\nsession = botocore.session.get_session()\\nexecution_role = sagemaker.get_execution_role()\\n\\nsg_client= session.create_client(\\n service_name='sagemaker-geospatial',\\n region_name=region\\n)\\n```\n\nStart an Earth Observation Job to identify the land cover types in the area of Jeju island.\n\nPython\n\n```\\n# Perform land cover segmentation on images returned from the sentinel dataset.\\neoj_input_config = {\\n \\"RasterDataCollectionQuery\\": {\\n \\"RasterDataCollectionArn\\": <ArnDataCollection,\\n \\"AreaOfInterest\\": {\\n \\"AreaOfInterestGeometry\\": {\\n \\"PolygonGeometry\\": {\\n \\"Coordinates\\": [\\n [[126.647226, 33.47014], [126.406116, 33.47014], [126.406116, 33.307529], [126.647226, 33.307529], [126.647226, 33.47014]]\\n ]\\n }\\n }\\n },\\n \\"TimeRangeFilter\\": {\\n \\"StartTime\\": \\"2022-11-01T00:00:00Z\\",\\n \\"EndTime\\": \\"2022-11-22T23:59:59Z\\"\\n },\\n \\"PropertyFilters\\": {\\n \\"Properties\\": [\\n {\\n \\"Property\\": {\\n \\"EoCloudCover\\": {\\n \\"LowerBound\\": 0,\\n \\"UpperBound\\": 20\\n }\\n }\\n }\\n ],\\n \\"LogicalOperator\\": \\"AND\\"\\n }\\n }\\n}\\neoj_config = {\\"LandCoverSegmentationConfig\\": {}}\\n\\nresponse = sg_client.start_earth_observation_job(\\n Name = \\"jeju-island-landcover\\", \\n InputConfig = eoj_input_config,\\n JobConfig = eoj_config, \\n ExecutionRoleArn = execution_role\\n)\\n# Monitor the EOJ status\\nsg_client.get_earth_observation_job(Arn = response['Arn'])\\n```\n\nAfter your EOJ is created, the ```Arn``` is returned to you. You use the Arn to identify a job and perform further operations. After finishing the job, visualize Earth Observation inputs and outputs in the visualization tool.\n\nPython\n\n```\\n# Creates an instance of the map to add EOJ input/ouput layer\\nmap = sagemaker_geospatial_map.create_map({\\n 'is_raster': True\\n})\\nmap.set_sagemaker_geospatial_client(sg_client)\\n# render the map\\nmap.render()\\n\\n# Visualize input, you can see EOJ is not be completed.\\ntime_range_filter={\\n \\"start_date\\": \\"2022-11-01T00:00:00Z\\",\\n \\"end_date\\": \\"2022-11-22T23:59:59Z\\"\\n}\\narn_to_visualize = response['Arn']\\nconfig = {\\n 'label': 'Jeju island'\\n}\\ninput_layer=map.visualize_eoj_input(Arn=arn_to_visualize, config=config , time_range_filter=time_range_filter)\\n\\n# Visualize output, EOJ needs to be in completed status\\ntime_range_filter={\\n \\"start_date\\": \\"2022-11-01T00:00:00Z\\",\\n \\"snd_date\\": \\"2022-11-22T23:59:59Z\\"\\n}\\n\\nconfig = {\\n 'preset': 'singleBand',\\n 'band_name': 'mask'\\n}\\noutput_layer = map.visualize_eoj_output(Arn=arn_to_visualize, config=config, time_range_filter=time_range_filter)\\n```\n\nYou can also execute the ```StartEarthObservationJob ```API using the AWS Command Line Interface (AWS CLI).\n\nWhen you create an Earth Observation Job in notebooks, you can use additional [geospatial functionalities](http://docs.aws.amazon.com/sagemaker/latest/dg/geospatial-eoj-models.html). Here is a list of some of the other geospatial operations that are supported by [Amazon SageMaker](https://aws.amazon.com/cn/sagemaker/?trk=cndc-detail):\n\n- **Band Stacking** – Combine multiple spectral properties to create a single image.\n- **Cloud Removal** – Remove pixels containing parts of a cloud from satellite imagery.\n- **Geomosaic** – Combine multiple images for greater fidelity.\n- **Resampling** – Scale images to different resolutions.\n- **Temporal Statistics** – Calculate statistics through time for multiple GeoTIFFs in the same area.\n- **Zonal Statistics** – Calculate statistics on user-defined regions.\n\nTo learn more, see [Amazon SageMaker geospatial notebook SDK](https://docs.aws.amazon.com/sagemaker/latest/dg/geospatial-notebook-sdk.html) and [Amazon SageMaker geospatial capability Service APIs](https://docs.aws.amazon.com/sagemaker/latest/APIReference/Welcome.html) in the AWS documentation and [geospatial sample codes in the GitHub](https://github.com/aws/amazon-sagemaker-examples/tree/main/sagemaker-geospatial/digital-farming-pipelines) repository.\n\n**++Perform a Vector Enrichment Job and Map Visualization++**\n\nA Vector Enrichment Job (VEJ) performs operations on your vector data, such as reverse geocoding or map matching.\n\n- **Reverse Geocoding** – Convert map coordinates to human-readable addresses powered by [Amazon Location Service](https://aws.amazon.com/cn/location/?trk=cndc-detail).\n- **Map Matching** – Match GPS coordinates to road segments.\n\nWhile you need to use an [Amazon SageMaker](https://aws.amazon.com/cn/sagemaker/?trk=cndc-detail) Studio notebook to execute a VEJ, you can view all the jobs you create.\n\n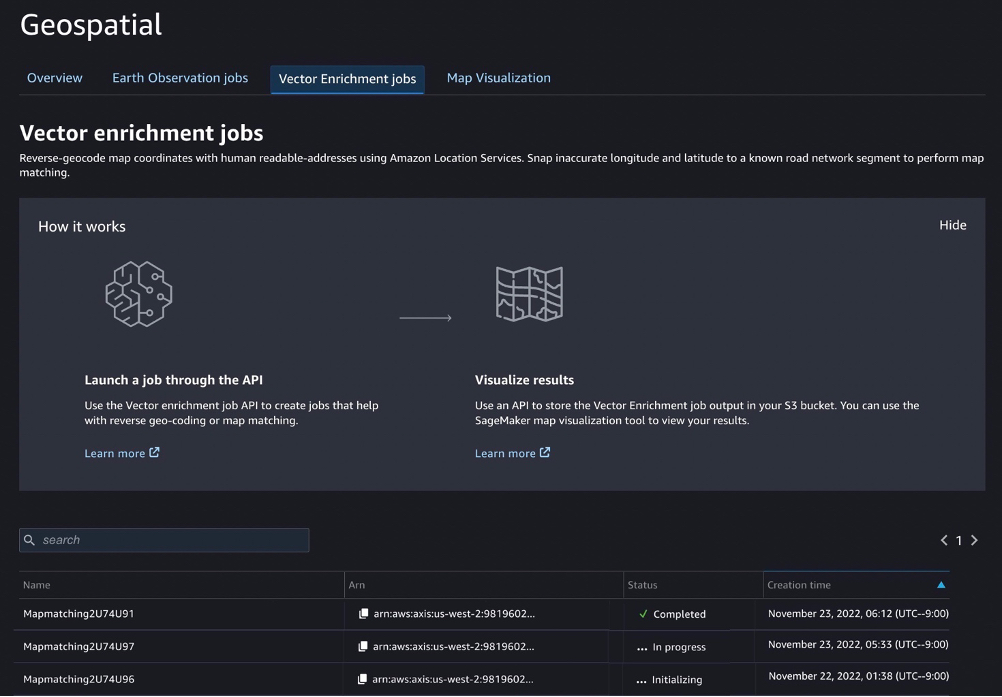\n\nWith the ```StartVectorEnrichmentJob ```API, you can create a VEJ for the supplied two job types.\n\nBash\n```\\n\\n{\\n \\"Name\\":\\"vej-reverse\\", \\n \\"InputConfig\\":{\\n \\"DocumentType\\":\\"csv\\", //\\n \\"DataSourceConfig\\":{\\n \\"S3Data\\":{\\n \\"S3Uri\\":\\"s3://channy-geospatial/sample/vej.csv\\",\\n } \\n }\\n }, \\n \\"JobConfig\\": {\\n \\"MapMatchingConfig\\": { \\n \\"YAttributeName\\":\\"string\\", // Latitude \\n \\"XAttributeName\\":\\"string\\", // Longitude \\n \\"TimestampAttributeName\\":\\"string\\", \\n \\"IdAttributeName\\":\\"string\\"\\n }\\n },\\n \\"ExecutionRoleArn\\":\\"string\\" \\n}\\n```\n\nYou can visualize the output of VEJ in the notebook or use the **Map Visualization** feature after you export VEJ jobs output to your S3 bucket. With the map visualization feature, you can easily show your geospatial data on the map.\n\n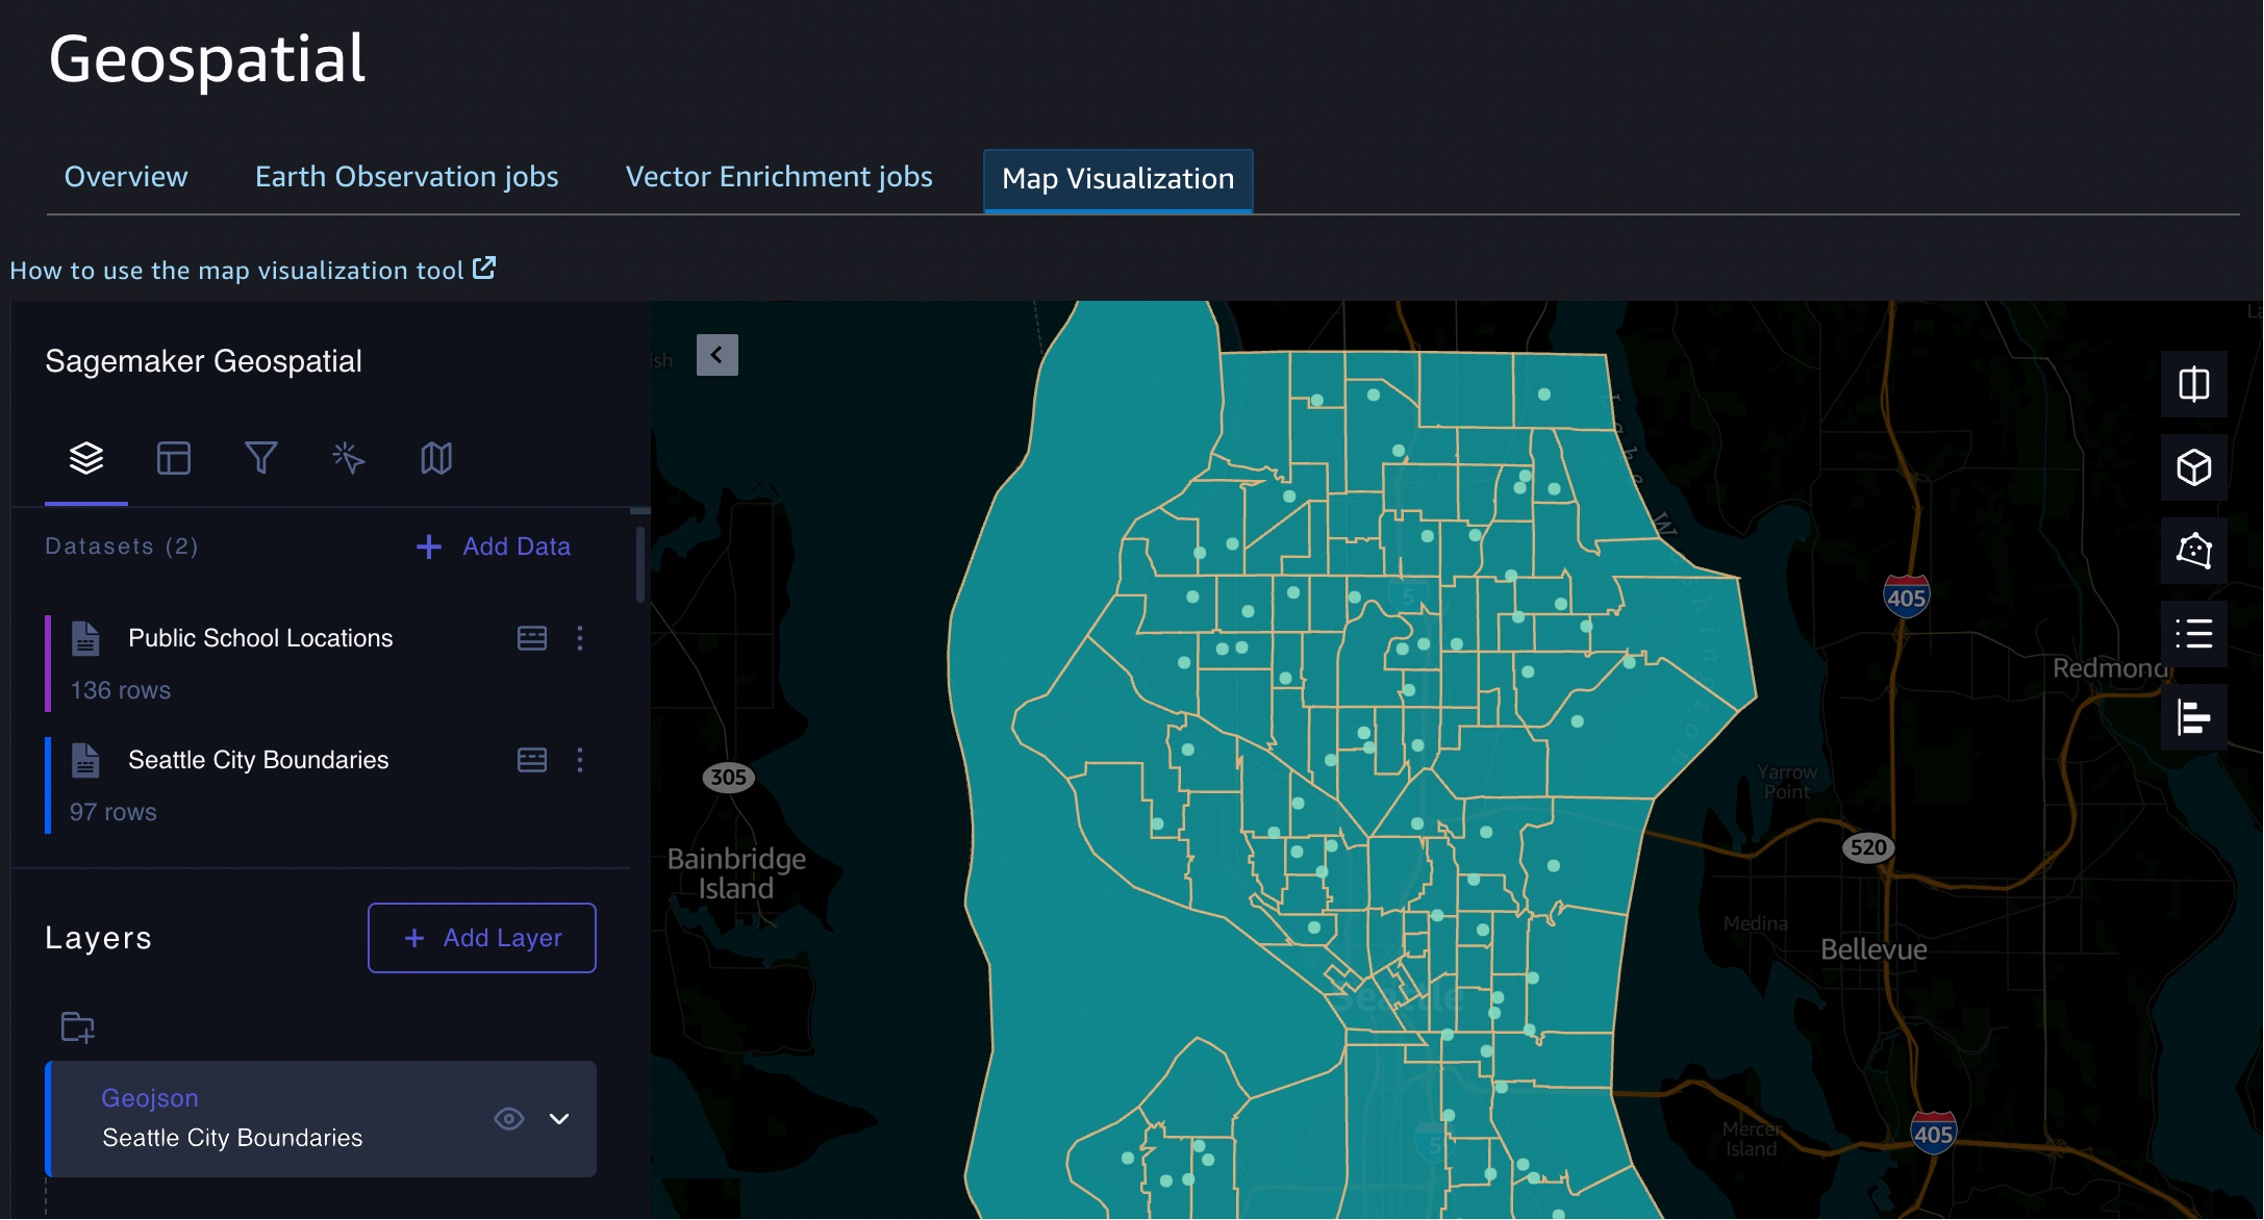\n\nThis sample visualization includes [Seattle City Council districts](https://github.com/seattleio/seattle-boundaries-data/blob/master/data/city-council-districts.geojson) and [public-school locations](https://github.com/seattleio/seattle-boundaries-data/blob/master/data/sps_school_site_2015_2016.geojson) in GeoJSON format. Select **Add data** to upload data files or select S3 bucket.\n\nJSON\n\n```\\n{\\n \\"type\\": \\"FeatureCollection\\",\\n \\"crs\\": { \\"type\\": \\"name\\", \\"properties\\": { \\n \\"name\\": \\"urn:ogc:def:crs:OGC:1.3:CRS84\\" } },\\n \\n \\"features\\": [\\n { \\"type\\": \\"Feature\\", \\"id\\": 1, \\"properties\\": { \\"PROPERTY_L\\": \\"Jane Addams\\", \\"Status\\": \\"MS\\" }, \\"geometry\\": { \\"type\\": \\"Point\\", \\"coordinates\\": [ -122.293009024934037, 47.709944862769468 ] } },\\n { \\"type\\": \\"Feature\\", \\"id\\": 2, \\"properties\\": { \\"PROPERTY_L\\": \\"Rainier View\\", \\"Status\\": \\"ELEM\\" }, \\"geometry\\": { \\"type\\": \\"Point\\", \\"coordinates\\": [ -122.263172064204767, 47.498863322205558 ] } },\\n { \\"type\\": \\"Feature\\", \\"id\\": 3, \\"properties\\": { \\"PROPERTY_L\\": \\"Emerson\\", \\"Status\\": \\"ELEM\\" }, \\"geometry\\": { \\"type\\": \\"Point\\", \\"coordinates\\": [ -122.258636146463658, 47.514820466363943 ] } }\\n ]\\n}\\n```\n\nThat’s all! For more information about each component, see [Amazon SageMaker geospatial Developer Guide.](https://docs.aws.amazon.com/sagemaker/latest/dg/geospatial.html)\n\n**++Join the Preview++**\n\nThe preview release of [Amazon SageMaker](https://aws.amazon.com/cn/sagemaker/?trk=cndc-detail) geospatial capability is now available in the US West (Oregon) Region.\n\nWe want to hear more feedback during the preview. Give it a try, and please send feedback to [AWS re:Post for Amazon SageMaker](https://repost.aws/tags/TAT80swPyVRPKPcA0rsJYPuA/amazon-sage-maker) or through your usual AWS support contacts.\n\n– [Channy](https://twitter.com/)\n\n\n\n\n### **[Channy Yun](https://aws.amazon.com/blogs/aws/author/channy-yun/)**\n\nChanny Yun is a Principal Developer Advocate for AWS, and passionate about helping developers to build modern applications on latest AWS services. A pragmatic developer and blogger at heart, he loves community-driven learning and sharing of technology, which has funneled developers to global AWS Usergroups. His main topics are open-source, container, storage, network & security, and IoT. Follow him on Twitter at @channyun.","render":"<p>You use map apps every day to find your favorite restaurant or travel the fastest route using geospatial data. There are two types of geospatial data: vector data that uses two-dimensional geometries such as a building location (points), roads (lines), or land boundary (polygons), and raster data such as satellite and aerial images.</p>\n<p>Last year, we introduced <a href=\\"https://aws.amazon.com/blogs/aws/amazon-location-service-is-now-generally-available-with-new-routing-and-satellite-imagery-capabilities/\\" target=\\"_blank\\">Amazon Location Service</a>, which makes it easy for developers to add location functionality to their applications. With [Amazon Location Service](https://aws.amazon.com/cn/location/?trk=cndc-detail), you can visualize a map, search points of interest, optimize delivery routes, track assets, and use geofencing to detect entry and exit events in your defined geographical boundary.</p>\\n<p><img src=\\"https://dev-media.amazoncloud.cn/196d8817bb9c43e39fadd598f678a74f_image.png\\" alt=\\"image.png\\" /></p>\n<p>However, if you want to make predictions from geospatial data using machine learning (ML), there are lots of challenges. When I studied geographic information systems (GIS) in graduate school, I was limited to a small data set that covered only a narrow area and had to contend with limited storage and only the computing power of my laptop at the time.</p>\n<p>These challenges include 1) acquiring and accessing high-quality geospatial datasets is complex as it requires working with multiple data sources and vendors, 2) preparing massive geospatial data for training and inference can be time-consuming and expensive, and 3) specialized tools are needed to visualize geospatial data and integrate with ML operation infrastructure</p>\n<p>Today I’m excited to announce the preview release of <a href=\\"https://aws.amazon.com/sagemaker/geospatial/\\" target=\\"_blank\\">Amazon SageMaker‘s new geospatial capabilities</a> that make it easy to build, train, and deploy ML models using geospatial data. This collection of features offers pre-trained deep neural network (DNN) models and geospatial operators that make it easy to access and prepare large geospatial datasets. All generated predictions can be visualized and explored on the map.</p>\\n<p>Also, you can use the new geospatial image to transform and visualize data inside geospatial notebooks using open-source libraries such as <a href=\\"https://numpy.org/\\" target=\\"_blank\\">NumPy</a>, <a href=\\"https://gdal.org/\\" target=\\"_blank\\">GDAL</a>, <a href=\\"https://geopandas.org/\\" target=\\"_blank\\">GeoPandas</a>, and <a href=\\"https://rasterio.readthedocs.io/en/latest/\\" target=\\"_blank\\">Rasterio</a>, as well as SageMaker-specific libraries.</p>\\n<p>With a few clicks in the <a href=\\"https://aws.amazon.com/sagemaker/studio\\" target=\\"_blank\\">SageMaker Studio</a> console, a fully integrated development environment (IDE) for ML, you can run an Earth Observation job, such as a land cover segmentation or launch notebooks. You can bring various geospatial data, for example, your own Planet Labs satellite data from <a href=\\"https://aws.amazon.com/s3\\" target=\\"_blank\\">Amazon S3</a>, or <a href=\\"https://registry.opendata.aws/usgs-landsat/\\" target=\\"_blank\\">US Geological Survey LANDSAT</a> and <a href=\\"https://registry.opendata.aws/sentinel-2-l2a-cogs\\" target=\\"_blank\\">Sentinel-2 </a>images from <a href=\\"https://registry.opendata.aws/?search=tags:gis,earth%20observation,events,mapping,meteorological,environmental,transportation\\" target=\\"_blank\\">Open Data on AWS</a>, [Amazon Location Service](https://aws.amazon.com/cn/location/?trk=cndc-detail), or bring your own data, such as location data generated from GPS devices, connected vehicles or internet of things (IoT) sensors, retail store foot traffic, geo-marketing and census data.</p>\\n<p>The Amazon SageMaker geospatial capabilities support use cases across any industry. For example, insurance companies can use satellite images to analyze the damage impact from natural disasters on local economies, and agriculture companies can track the health of crops, predict harvest yield, and forecast regional demand for agricultural produce. Retailers can combine location and map data with competitive intelligence to optimize new store locations worldwide. These are just a few of the example use cases. You can turn your own ideas into reality!</p>\n<p><strong><ins>Introducing Amazon SageMaker Geospatial Capabilities</ins></strong></p>\n<p>In the preview, you can use SageMaker Studio initialized in the US West (Oregon) Region. Make sure to set the default Jupyter Lab 3 as the version when you create a new user in the Studio. To learn more about setting up SageMaker Studio, see <a href=\\"https://docs.aws.amazon.com/sagemaker/latest/dg/onboard-quick-start.html\\" target=\\"_blank\\">Onboard to Amazon SageMaker Domain Using Quick setup</a> in the AWS documentation.</p>\\n<p>Now you can find the <strong>Geospatial</strong> section by navigating to the homepage and scrolling down in SageMaker Studio’s new <strong>Launcher</strong> tab.</p>\\n<p><img src=\\"https://dev-media.amazoncloud.cn/c2fb76e09a644fa99732dd08de5e03e0_image.png\\" alt=\\"image.png\\" /></p>\n<p>Here is an overview of three key Amazon SageMaker geospatial capabilities:</p>\n<ul>\\n<li><strong>Earth Observation jobs</strong> – Acquire, transform, and visualize satellite imagery data to make predictions and get useful insights.</li>\\n<li><strong>Vector Enrichment jobs</strong> – Enrich your data with operations, such as converting geographical coordinates to readable addresses from CSV files.</li>\\n<li><strong>Map Visualization</strong> – Visualize satellite images or map data uploaded from a CSV, JSON, or GeoJSON file.</li>\\n</ul>\n<p>Let’s dive deep into each component!</p>\n<p><strong><ins>Get Started with an Earth Observation Job</ins></strong></p>\n<p>To get started with Earth Observation jobs, select <strong>Create Earth Observation job</strong> on the front page.</p>\\n<p><img src=\\"https://dev-media.amazoncloud.cn/9bcae3fbfedf4fd584e591cdc9db9d4b_image.png\\" alt=\\"image.png\\" /></p>\n<p>You can select one of the geospatial operations or ML models based on your use case.</p>\n<ul>\\n<li><strong>Spectral Index</strong> – Obtain a combination of spectral bands that indicate the abundance of features of interest.</li>\\n<li><strong>Cloud Masking</strong> – Identify cloud and cloud-free pixels to get clear and accurate satellite imagery.</li>\\n<li><strong>Land Cover Segmentation</strong> – Identify land cover types such as vegetation and water in satellite imagery.</li>\\n</ul>\n<p>The SageMaker provides a combination of geospatial functionalities that include built-in operations for data transformations along with pretrained ML models. You can use these models to understand the impact of environmental changes and human activities over time, identify cloud and cloud-free pixels, and perform semantic segmentation.</p>\n<p>Define a <strong>Job name</strong>, choose a model to be used, and click the bottom-right <strong>Next</strong> button to move to the second configuration step.</p>\\n<p>Next, you can define an area of interest (AOI), the satellite image data set you want to use, and filters for your job. The left screen shows the <strong>Area of Interest</strong> map to visualize for your <strong>Earth Observation Job</strong> selection, and the right screen contains satellite images and filter options for your AOI.</p>\\n<p><img src=\\"https://dev-media.amazoncloud.cn/953a3ea19c7b46769c4500ed6a3b8fcf_image.png\\" alt=\\"image.png\\" /></p>\n<p>You can choose the satellite image collection, either USGS LANDSAT or Sentinel-2 images, the date span for your Earth Observation job, and filters on properties of your images in the filter section.</p>\n<p>I uploaded GeoJSON format to define my AOI as the <a href=\\"https://en.wikipedia.org/wiki/Hallasan\\" target=\\"_blank\\">Mountain Halla </a>area in <a href=\\"https://en.wikipedia.org/wiki/Jeju_Island\\" target=\\"_blank\\">Jeju island</a>, South Korea. I select all job properties and options and choose <strong>Create</strong>.</p>\\n<p>Once the Earth Observation job is successfully created, a flashbar will appear where I can view my job details by pressing the <strong>View job details</strong> button.</p>\\n<p><img src=\\"https://dev-media.amazoncloud.cn/2ba1139186c64ababda3ef2c506b5a94_image.png\\" alt=\\"image.png\\" /></p>\n<p>Once the job is finished, I can <strong>Visualize job output</strong>.</p>\\n<p><img src=\\"https://dev-media.amazoncloud.cn/bfe0da78795c4721b50adcaa23ef56aa_image.png\\" alt=\\"image.png\\" /></p>\n<p>This image is a job output on rendering process to detect land usage from input satellite images. You can see either input images, output images, or the AOI from data layers in the left pane.</p>\n<p>It shows automatic mapping results of land cover for natural resource management. For example, the yellow area is the sea, green is cloud, dark orange is forest, and orange is land.</p>\n<p><img src=\\"https://dev-media.amazoncloud.cn/86f71b10db524ce68c647ba4bb68dfdc_image.png\\" alt=\\"image.png\\" /></p>\n<p>You can also execute the same job with SageMaker notebook using the geospatial image with geospatial SDKs.</p>\n<p>From the <strong>File</strong> and <strong>New</strong>, choose <strong>Notebook</strong> and select the <strong>Image</strong> dropdown menu in the <strong>Setup notebook environment</strong> and choose <strong>Geospatial 1.0</strong>. Let the other settings be set to the default values.</p>\\n<p><img src=\\"https://dev-media.amazoncloud.cn/96e3c7baed934ecb9b60604a5ab62229_image.png\\" alt=\\"image.png\\" /></p>\n<p>Let’s look at Python sample code! First, set up SageMaker geospatial libraries.</p>\n<p>Python</p>\n<pre><code class=\\"lang-\\">import boto3\\nimport botocore\\nimport sagemaker\\nimport sagemaker_geospatial_map\\n\\nregion = boto3.Session().region_name\\nsession = botocore.session.get_session()\\nexecution_role = sagemaker.get_execution_role()\\n\\nsg_client= session.create_client(\\n service_name='sagemaker-geospatial',\\n region_name=region\\n)\\n</code></pre>\\n<p>Start an Earth Observation Job to identify the land cover types in the area of Jeju island.</p>\n<p>Python</p>\n<pre><code class=\\"lang-\\"># Perform land cover segmentation on images returned from the sentinel dataset.\\neoj_input_config = {\\n "RasterDataCollectionQuery": {\\n "RasterDataCollectionArn": <ArnDataCollection,\\n "AreaOfInterest": {\\n "AreaOfInterestGeometry": {\\n "PolygonGeometry": {\\n "Coordinates": [\\n [[126.647226, 33.47014], [126.406116, 33.47014], [126.406116, 33.307529], [126.647226, 33.307529], [126.647226, 33.47014]]\\n ]\\n }\\n }\\n },\\n "TimeRangeFilter": {\\n "StartTime": "2022-11-01T00:00:00Z",\\n "EndTime": "2022-11-22T23:59:59Z"\\n },\\n "PropertyFilters": {\\n "Properties": [\\n {\\n "Property": {\\n "EoCloudCover": {\\n "LowerBound": 0,\\n "UpperBound": 20\\n }\\n }\\n }\\n ],\\n "LogicalOperator": "AND"\\n }\\n }\\n}\\neoj_config = {"LandCoverSegmentationConfig": {}}\\n\\nresponse = sg_client.start_earth_observation_job(\\n Name = "jeju-island-landcover", \\n InputConfig = eoj_input_config,\\n JobConfig = eoj_config, \\n ExecutionRoleArn = execution_role\\n)\\n# Monitor the EOJ status\\nsg_client.get_earth_observation_job(Arn = response['Arn'])\\n</code></pre>\\n<p>After your EOJ is created, the <code>Arn</code> is returned to you. You use the Arn to identify a job and perform further operations. After finishing the job, visualize Earth Observation inputs and outputs in the visualization tool.</p>\\n<p>Python</p>\n<pre><code class=\\"lang-\\"># Creates an instance of the map to add EOJ input/ouput layer\\nmap = sagemaker_geospatial_map.create_map({\\n 'is_raster': True\\n})\\nmap.set_sagemaker_geospatial_client(sg_client)\\n# render the map\\nmap.render()\\n\\n# Visualize input, you can see EOJ is not be completed.\\ntime_range_filter={\\n "start_date": "2022-11-01T00:00:00Z",\\n "end_date": "2022-11-22T23:59:59Z"\\n}\\narn_to_visualize = response['Arn']\\nconfig = {\\n 'label': 'Jeju island'\\n}\\ninput_layer=map.visualize_eoj_input(Arn=arn_to_visualize, config=config , time_range_filter=time_range_filter)\\n\\n# Visualize output, EOJ needs to be in completed status\\ntime_range_filter={\\n "start_date": "2022-11-01T00:00:00Z",\\n "snd_date": "2022-11-22T23:59:59Z"\\n}\\n\\nconfig = {\\n 'preset': 'singleBand',\\n 'band_name': 'mask'\\n}\\noutput_layer = map.visualize_eoj_output(Arn=arn_to_visualize, config=config, time_range_filter=time_range_filter)\\n</code></pre>\\n<p>You can also execute the <code>StartEarthObservationJob </code>API using the AWS Command Line Interface (AWS CLI).</p>\\n<p>When you create an Earth Observation Job in notebooks, you can use additional <a href=\\"http://docs.aws.amazon.com/sagemaker/latest/dg/geospatial-eoj-models.html\\" target=\\"_blank\\">geospatial functionalities</a>. Here is a list of some of the other geospatial operations that are supported by [Amazon SageMaker](https://aws.amazon.com/cn/sagemaker/?trk=cndc-detail):</p>\\n<ul>\\n<li><strong>Band Stacking</strong> – Combine multiple spectral properties to create a single image.</li>\\n<li><strong>Cloud Removal</strong> – Remove pixels containing parts of a cloud from satellite imagery.</li>\\n<li><strong>Geomosaic</strong> – Combine multiple images for greater fidelity.</li>\\n<li><strong>Resampling</strong> – Scale images to different resolutions.</li>\\n<li><strong>Temporal Statistics</strong> – Calculate statistics through time for multiple GeoTIFFs in the same area.</li>\\n<li><strong>Zonal Statistics</strong> – Calculate statistics on user-defined regions.</li>\\n</ul>\n<p>To learn more, see <a href=\\"https://docs.aws.amazon.com/sagemaker/latest/dg/geospatial-notebook-sdk.html\\" target=\\"_blank\\">Amazon SageMaker geospatial notebook SDK</a> and <a href=\\"https://docs.aws.amazon.com/sagemaker/latest/APIReference/Welcome.html\\" target=\\"_blank\\">Amazon SageMaker geospatial capability Service APIs</a> in the AWS documentation and <a href=\\"https://github.com/aws/amazon-sagemaker-examples/tree/main/sagemaker-geospatial/digital-farming-pipelines\\" target=\\"_blank\\">geospatial sample codes in the GitHub</a> repository.</p>\\n<p><strong><ins>Perform a Vector Enrichment Job and Map Visualization</ins></strong></p>\n<p>A Vector Enrichment Job (VEJ) performs operations on your vector data, such as reverse geocoding or map matching.</p>\n<ul>\\n<li><strong>Reverse Geocoding</strong> – Convert map coordinates to human-readable addresses powered by [Amazon Location Service](https://aws.amazon.com/cn/location/?trk=cndc-detail).</li>\\n<li><strong>Map Matching</strong> – Match GPS coordinates to road segments.</li>\\n</ul>\n<p>While you need to use an Amazon SageMaker Studio notebook to execute a VEJ, you can view all the jobs you create.</p>\n<p><img src=\\"https://dev-media.amazoncloud.cn/aa34da6932ae4defb09f1db21638bb59_image.png\\" alt=\\"image.png\\" /></p>\n<p>With the <code>StartVectorEnrichmentJob </code>API, you can create a VEJ for the supplied two job types.</p>\\n<p>Bash</p>\n<pre><code class=\\"lang-\\">\\n{\\n "Name":"vej-reverse", \\n "InputConfig":{\\n "DocumentType":"csv", //\\n "DataSourceConfig":{\\n "S3Data":{\\n "S3Uri":"s3://channy-geospatial/sample/vej.csv",\\n } \\n }\\n }, \\n "JobConfig": {\\n "MapMatchingConfig": { \\n "YAttributeName":"string", // Latitude \\n "XAttributeName":"string", // Longitude \\n "TimestampAttributeName":"string", \\n "IdAttributeName":"string"\\n }\\n },\\n "ExecutionRoleArn":"string" \\n}\\n</code></pre>\\n<p>You can visualize the output of VEJ in the notebook or use the <strong>Map Visualization</strong> feature after you export VEJ jobs output to your S3 bucket. With the map visualization feature, you can easily show your geospatial data on the map.</p>\\n<p><img src=\\"https://dev-media.amazoncloud.cn/f896e6bfa46848948b567db49e111f7b_image.png\\" alt=\\"image.png\\" /></p>\n<p>This sample visualization includes <a href=\\"https://github.com/seattleio/seattle-boundaries-data/blob/master/data/city-council-districts.geojson\\" target=\\"_blank\\">Seattle City Council districts</a> and <a href=\\"https://github.com/seattleio/seattle-boundaries-data/blob/master/data/sps_school_site_2015_2016.geojson\\" target=\\"_blank\\">public-school locations</a> in GeoJSON format. Select <strong>Add data</strong> to upload data files or select S3 bucket.</p>\\n<p>JSON</p>\n<pre><code class=\\"lang-\\">{\\n "type": "FeatureCollection",\\n "crs": { "type": "name", "properties": { \\n "name": "urn:ogc:def:crs:OGC:1.3:CRS84" } },\\n \\n "features": [\\n { "type": "Feature", "id": 1, "properties": { "PROPERTY_L": "Jane Addams", "Status": "MS" }, "geometry": { "type": "Point", "coordinates": [ -122.293009024934037, 47.709944862769468 ] } },\\n { "type": "Feature", "id": 2, "properties": { "PROPERTY_L": "Rainier View", "Status": "ELEM" }, "geometry": { "type": "Point", "coordinates": [ -122.263172064204767, 47.498863322205558 ] } },\\n { "type": "Feature", "id": 3, "properties": { "PROPERTY_L": "Emerson", "Status": "ELEM" }, "geometry": { "type": "Point", "coordinates": [ -122.258636146463658, 47.514820466363943 ] } }\\n ]\\n}\\n</code></pre>\\n<p>That’s all! For more information about each component, see <a href=\\"https://docs.aws.amazon.com/sagemaker/latest/dg/geospatial.html\\" target=\\"_blank\\">Amazon SageMaker geospatial Developer Guide.</a></p>\\n<p><strong><ins>Join the Preview</ins></strong></p>\n<p>The preview release of Amazon SageMaker geospatial capability is now available in the US West (Oregon) Region.</p>\n<p>We want to hear more feedback during the preview. Give it a try, and please send feedback to <a href=\\"https://repost.aws/tags/TAT80swPyVRPKPcA0rsJYPuA/amazon-sage-maker\\" target=\\"_blank\\">AWS re:Post for Amazon SageMaker</a> or through your usual AWS support contacts.</p>\\n<p>– <a href=\\"https://twitter.com/\\" target=\\"_blank\\">Channy</a></p>\\n<p><img src=\\"https://dev-media.amazoncloud.cn/29884894c0d94c498e8510e225f7e301_image.png\\" alt=\\"image.png\\" /></p>\n<h3><a id=\\"Channy_Yunhttpsawsamazoncomblogsawsauthorchannyyun_270\\"></a><strong><a href=\\"https://aws.amazon.com/blogs/aws/author/channy-yun/\\" target=\\"_blank\\">Channy Yun</a></strong></h3>\n<p>Channy Yun is a Principal Developer Advocate for AWS, and passionate about helping developers to build modern applications on latest AWS services. A pragmatic developer and blogger at heart, he loves community-driven learning and sharing of technology, which has funneled developers to global AWS Usergroups. His main topics are open-source, container, storage, network & security, and IoT. Follow him on Twitter at @channyun.</p>\n"}
Preview: Use Amazon SageMaker to Build, Train, and Deploy ML Models Using Geospatial Data
海外精选
re:Invent
Amazon SageMaker

海外精选的内容汇集了全球优质的亚马逊云科技相关技术内容。同时,内容中提到的“AWS”
是 “Amazon Web Services” 的缩写,在此网站不作为商标展示。

 0
0 0
0

亚马逊云科技解决方案 基于行业客户应用场景及技术领域的解决方案
联系亚马逊云科技专家
亚马逊云科技解决方案
基于行业客户应用场景及技术领域的解决方案
联系专家

0
目录

 分享
分享 点赞
点赞 收藏
收藏 目录
目录立即注册,开启您的免费套餐
立即关注

亚马逊云开发者
公众号

User Group
公众号

亚马逊云科技
官方小程序
“AWS” 是 “Amazon Web Services” 的缩写,在此网站不作为商标展示。
立即关注
亚马逊云开发者
公众号
User Group
公众号
亚马逊云科技
官方小程序
“AWS” 是 “Amazon Web Services” 的缩写,在此网站不作为商标展示。
关于我们 
更多资源
开发者工具
更多支持
立即关注
亚马逊云开发者
公众号
User Group
公众号
亚马逊云科技
官方小程序
“AWS” 是 “Amazon Web Services” 的缩写,在此网站不作为商标展示。
