{"value":"Deploying applications using multiple Amazon Web Services accounts is a good practice to establish security and billing boundaries between teams and reduce the impact of operational events. When you adopt a multi-account strategy, you have to analyze telemetry data that is scattered across several accounts. To give you the flexibility to monitor all the components of your applications from a centralized view, we are introducing today[ Amazon CloudWatch ](https://aws.amazon.com/cloudwatch/)**cross-account observability**, a new capability to search, analyze, and correlate cross-account telemetry data stored in CloudWatch such as metrics, logs, and traces.\n\nYou can now set up a central monitoring Amazon Web Services account and connect your other accounts as sources. Then, you can search, audit, and analyze logs across your applications to drill down into operational issues in a matter of seconds. You can discover and visualize metrics from many accounts in a single place and create alarms that evaluate metrics belonging to other accounts. You can start with an aggregated cross-account view of your application to visually identify the resources exhibiting errors and dive deep into correlated traces, metrics, and logs to find the root cause. This seamless cross-account data access and navigation helps reduce the time and effort required to troubleshoot issues.\n\nLet’s see how this works in practice.\n\n**++Configuring CloudWatch Cross-Account Observability++**\n\nTo enable cross-account observability, CloudWatch has introduced the concept of monitoring and source accounts:\n\n- A **monitoring account** is a central Amazon Web Services account that can view and interact with observability data shared by other accounts.\n- A **source account** is an individual Amazon Web Services account that shares observability data and resources with one or more monitoring accounts.\n\nYou can configure multiple monitoring accounts with the level of visibility you need. CloudWatch cross-account observability is also integrated with [Amazon Web Services Organizations.](https://aws.amazon.com/organizations/) For example, I can have a monitoring account with wide access to all accounts in my organization for central security and operational teams and then configure other monitoring accounts with more restricted visibility across a business unit for individual service owners.\n\nFirst, I configure the **monitoring account**. In the [CloudWatch console](https://console.aws.amazon.com/cloudwatch), I choose **Settings **in the navigation pane. In the **Monitoring account configuration** section, I choose **Configure**.\n\n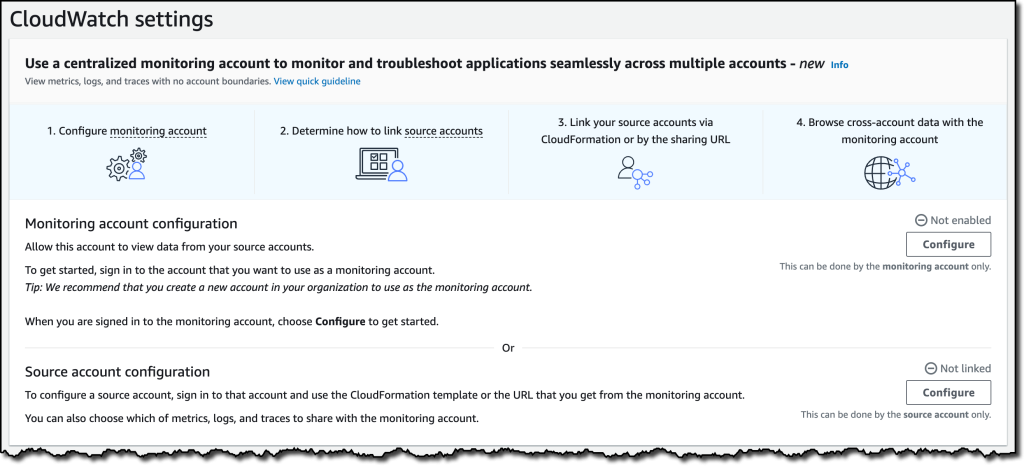\n\nNow I can choose which telemetry data can be shared with the monitoring account: **Logs**, **Metrics**, and **Traces**. I leave all three enabled.\n\n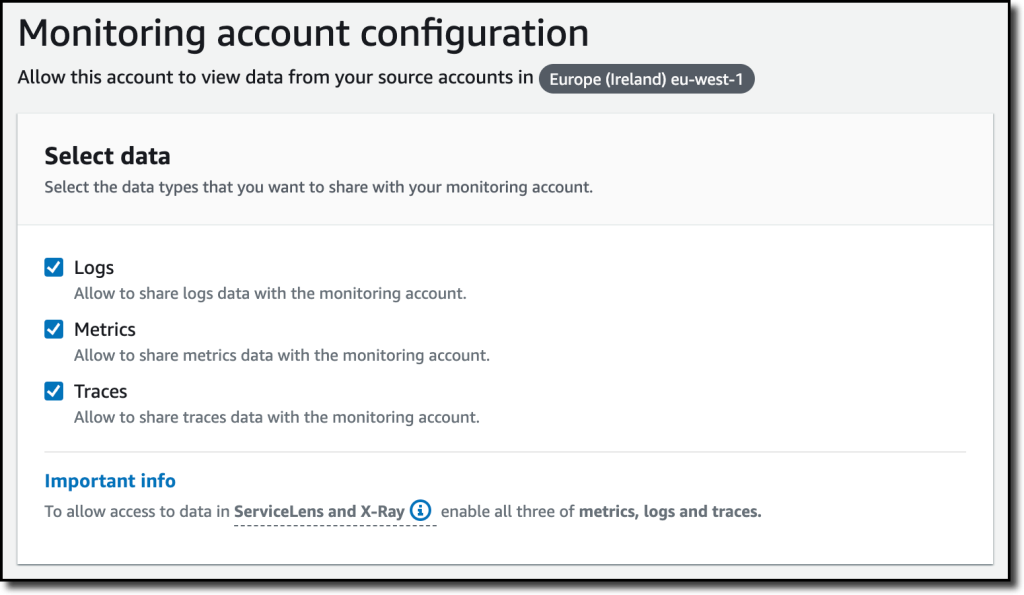\n\nTo list the source accounts that will share data with this monitoring account, I can use account IDs, organization IDs, or organization paths. I can use an organization ID to include all the accounts in the organization or an organization path to include all the accounts in a department or business unit. In my case, I have only one source account to link, so I enter the account ID.\n\n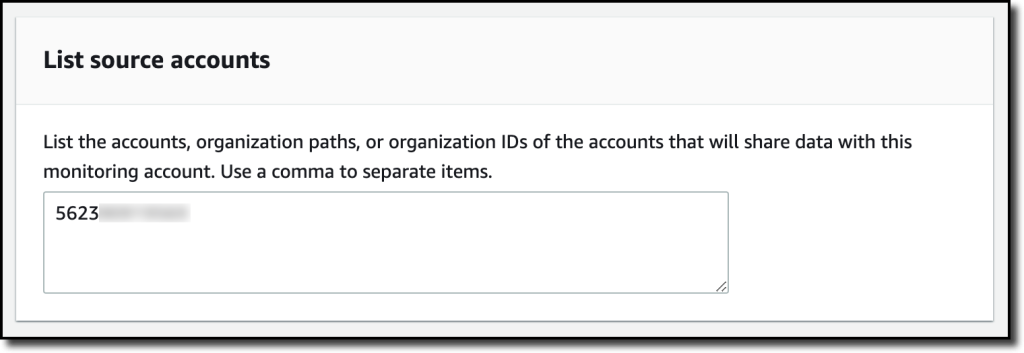\n\nWhen using the CloudWatch console in the monitoring account to search and display telemetry data, I see the account ID that shared that data. Because account IDs are not easy to remember, I can display a more descriptive “account label.” When configuring the label via the console, I can choose between the account name or the email address used to identify the account. When using an email address, I can also choose whether to include the domain. For example, if all the emails used to identify my accounts are using the same domain, I can use as labels the email addresses without that domain.\n\nThere is a quick reminder that cross-account observability only works in the selected Region. If I have resources in multiple Regions, I can configure cross-account observability in each Region. To complete the configuration of the monitoring account, I choose **Configure**.\n\n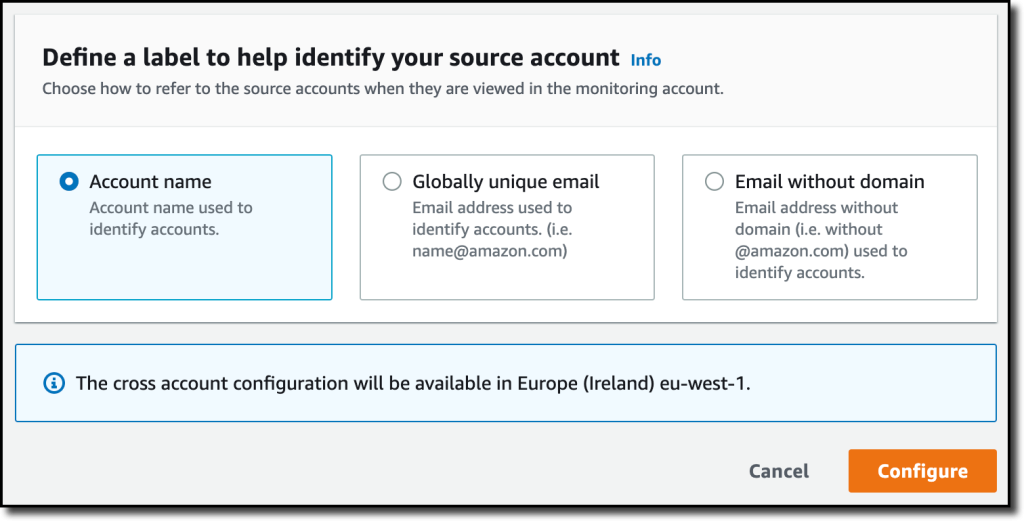\n\nThe monitoring account is now enabled, and I choose **Resources to link accounts** to determine how to link my source accounts.\n\n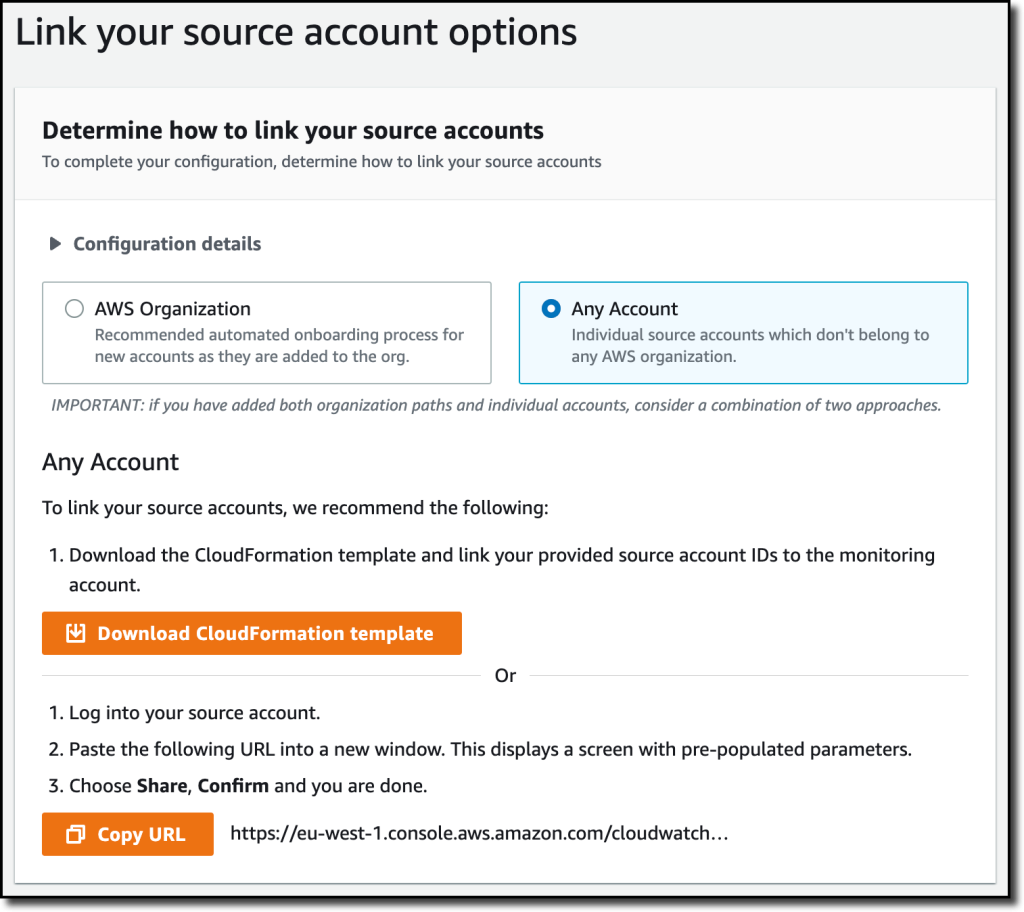\n\nTo link source accounts in an [Amazon Web Services organization](https://aws.amazon.com/cloudformation/), I can download an Amazon Web Services CloudFormation template to be deployed in a CloudFormation delegated administration account.\n\nTo link individual accounts, I can either download a CloudFormation template to be deployed in each account or copy a URL that helps me use the console to set up the accounts. I copy the URL and paste it into another browser where I am signed in as the source account. Then, I can configure which telemetry data to share (logs, metrics, or traces). The Amazon Resource Name (ARN) of the monitoring account configuration is pre-filled because I copy-pasted the URL in the previous step. If I don’t use the URL, I can copy the ARN from the monitoring account and paste it here. I confirm the label used to identify my source account and choose **Link**.\n\nIn the **Confirm monitoring account permission** dialog, I type **Confirm **to complete the configuration of the source account.\n\n**++Using CloudWatch Cross-Account Observability++**\n\nTo see how things work with cross-account observability, I deploy a simple cross-account application using two [Amazon Web Services Lambda](https://aws.amazon.com/lambda/) functions, one in the source account (```multi-account-function-a```) and one in the monitoring account (```multi-account-function-b```). When triggered, the function in the source account publishes an event to an [Amazon EventBridge](https://aws.amazon.com/eventbridge) event bus in the monitoring account. There, an EventBridge rule triggers the execution of the function in the monitoring account. This is a simplified setup using only two accounts. You’d probably have your workloads running in multiple source accounts.\n\n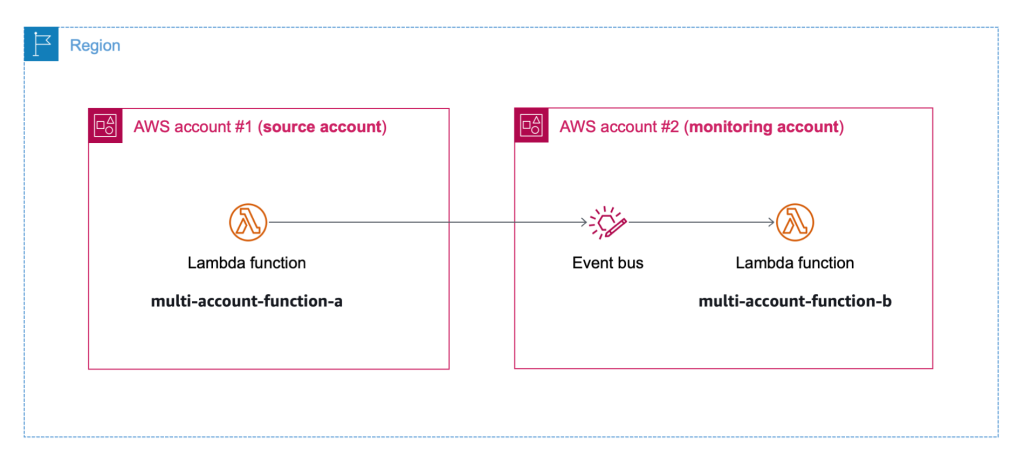\n\nIn the [Lambda console](https://console.aws.amazon.com/lambda), the two Lambda functions have **Active tracing** and **Enhanced monitoring** enabled. To collect telemetry data, I use the [Amazon Web Services Distro for OpenTelemetry (ADOT) Lambda layer](https://aws-otel.github.io/docs/getting-started/lambda). The Enhanced monitoring option turns on [Amazon CloudWatch Lambda Insights](https://docs.aws.amazon.com/lambda/latest/dg/monitoring-insights.html) to collect and aggregate Lambda function runtime performance metrics.\n\n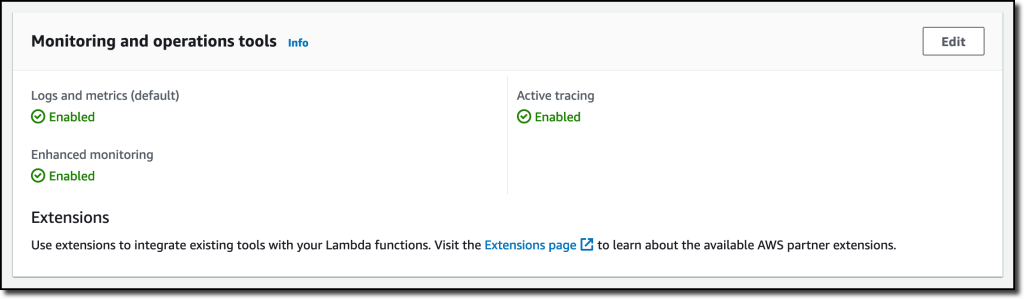\n\nI prepare a [test event](https://docs.aws.amazon.com/lambda/latest/dg/testing-functions.html) in the Lambda console of the source account. Then, I choose **Test **and run the function a few times.\n\n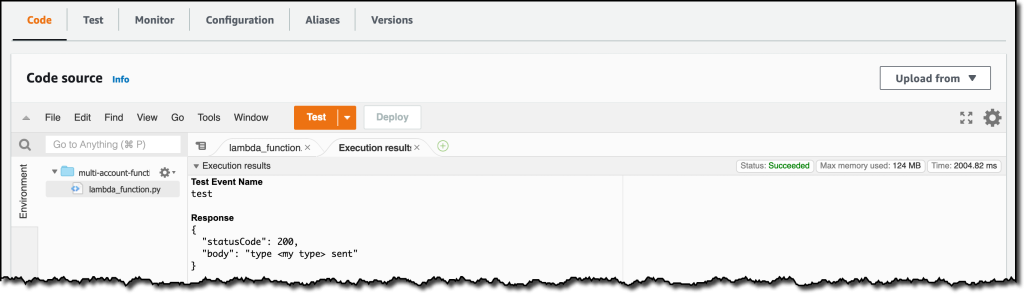\n\nNow, I want to understand what the components of my application, running in different accounts, are doing. I start with logs and then move to metrics and traces.\n\nIn the CloudWatch console of the **monitoring account**, I choose **Log groups** in the **Logs** section of the navigation pane. There, I search for and find the log groups created by the two Lambda functions running in different Amazon Web Services accounts. As expected, each log group shows the account ID and label originating the data. I select both log groups and choose **View in Logs Insights**.\n\n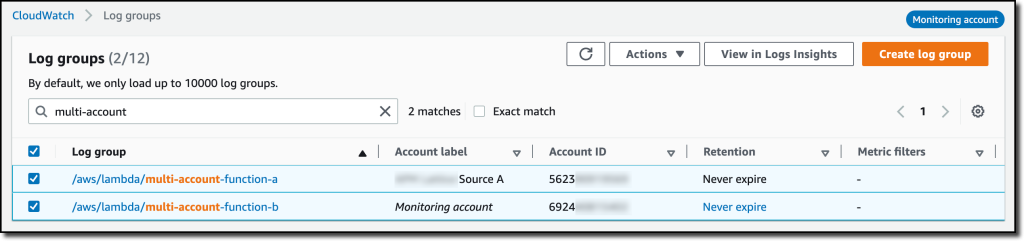\n\nI can now search and analyze logs from different Amazon Web Services accounts using the [CloudWatch Logs Insights query syntax](https://docs.aws.amazon.com/AmazonCloudWatch/latest/logs/CWL_QuerySyntax.html). For example, I run a simple query to see the last twenty messages in the two log groups. I include the ```@log``` field to see the account ID that the log belongs to.\n\n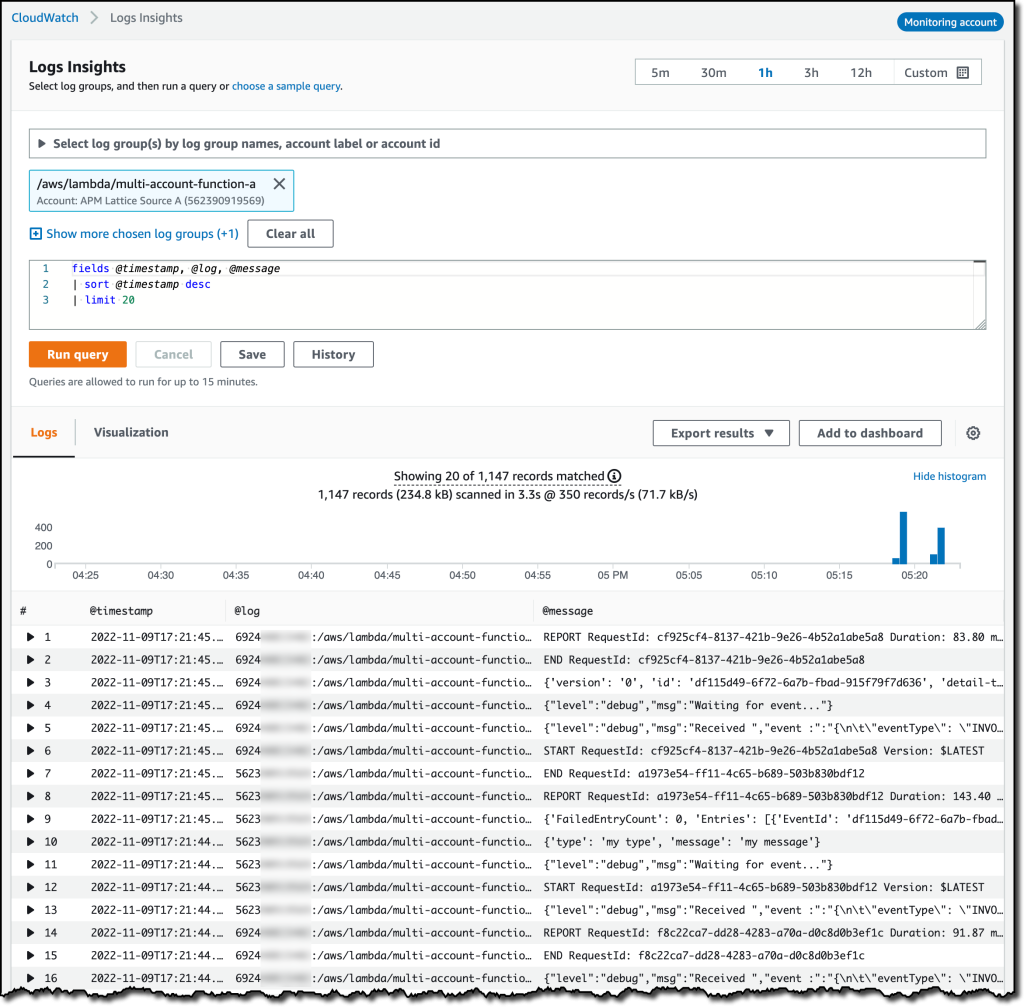\n\nI can now also create [Contributor Insights rules](https://docs.aws.amazon.com/AmazonCloudWatch/latest/monitoring/ContributorInsights.html) on cross-account log groups. This enables me, for example, to have a holistic view of what security events are happening across accounts or identify the most expensive Lambda requests in a serverless application running in multiple accounts.\n\nThen, I choose **All metrics** in the **Metrics** section of the navigation pane. To see the Lambda function runtime performance metrics collected by CloudWatch Lambda Insights, I choose LambdaInsights and then function_name. There, I search for ```multi-account``` and ```memory``` to see the memory metrics. Again, I see the account IDs and labels that tell me that these metrics are coming from two different accounts. From here, I can just select the metrics I am interested in and create cross-account dashboards and alarms. With the metrics selected, I choose **Add to dashboard** in the **Actions** dropdown.\n\n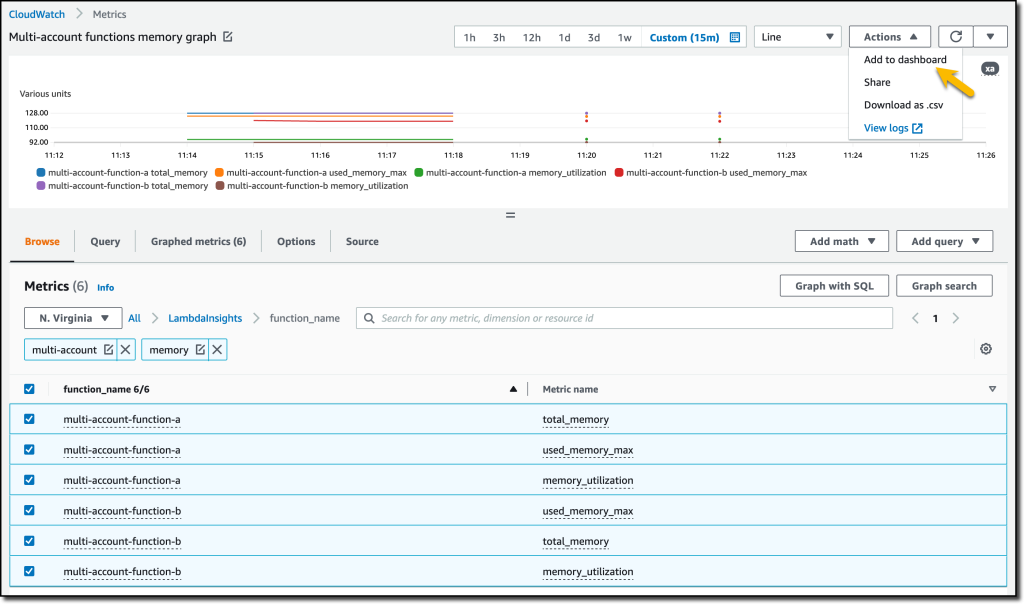\n\nI create a new dashboard and choose the **Stacked area** widget type. Then, I choose **Add to dashboard**.\n\n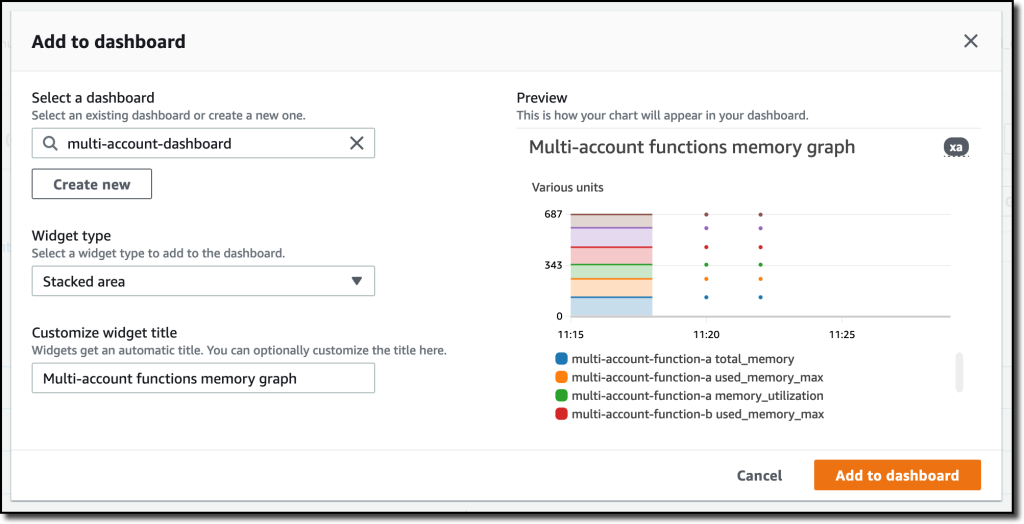\n\nI do the same for the CPU and memory metrics (but using different widget types) to quickly create a **cross-account dashboard** where I can keep under control my multi-account setup. Well, there isn’t a lot of traffic yet but I am hopeful.\n\n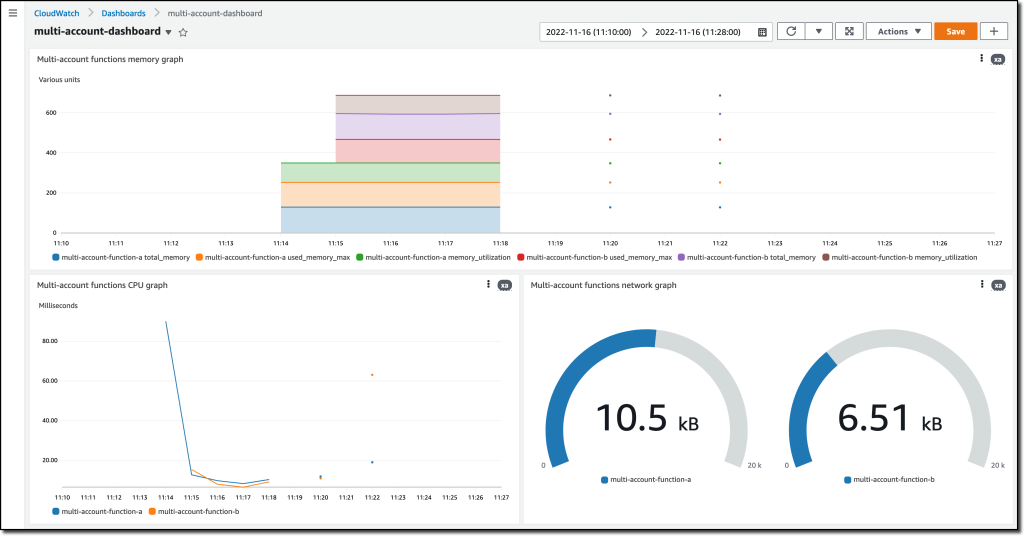\n\nFinally, I choose **Service map** from the **X-Ray traces** section of the navigation pane to see the flow of my multi-account application. In the service map, the client triggers the Lambda function in the source account. Then, an event is sent to the other account to run the other Lambda function.\n\n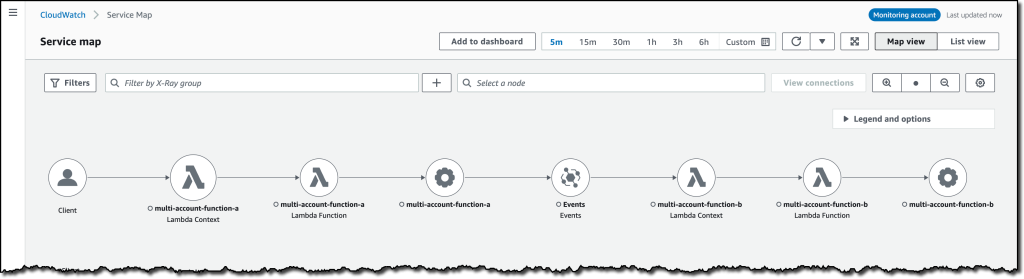\n\nIn the service map, I select the gear icon for the function running in the source account (```multi-account-function-a```) and then **View traces** to look at the individual traces. The traces contain data from multiple Amazon Web Services accounts. I can search for traces coming from a specific account using a syntax such as:\n\n```\nservice(id(account.id: \"123412341234\"))\n```\n\n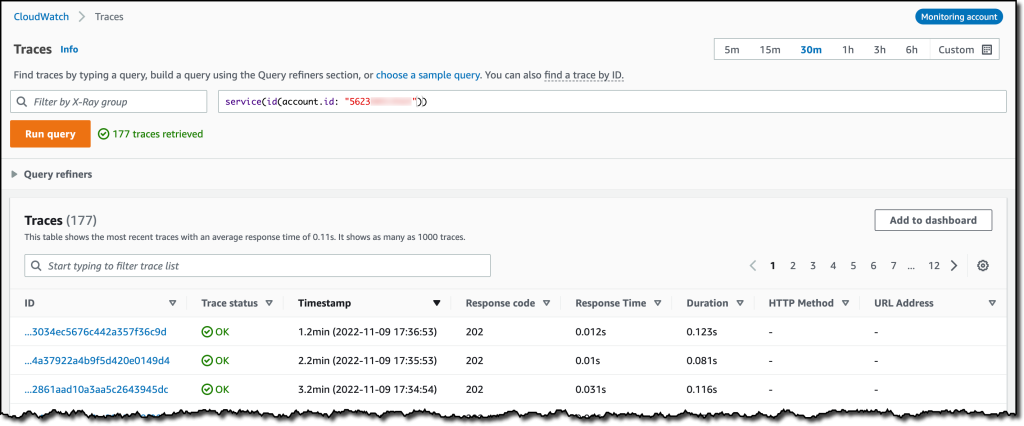\n\n\nThe service map now stitches together telemetry from multiple accounts in a single place, delivering a consolidated view to monitor their cross-account applications. This helps me to pinpoint issues quickly and reduces resolution time.\n\n**++Availability and Pricing++**\n\n[Amazon CloudWatch ](https://aws.amazon.com/cloudwatch/)cross-account observability is available today in all commercial Amazon Web Services Regions using the [Amazon Web Services Management Console](https://console.aws.amazon.com/), [Amazon Web Services Command Line Interface (CLI)](https://aws.amazon.com/cli/), and [Amazon Web Services SDKs](https://aws.amazon.com/tools/).[ Amazon Web Services CloudFormation](https://aws.amazon.com/cloudformation/) support is coming in the next few days. Cross-account observability in CloudWatch comes with no extra cost for logs and metrics, and the first trace copy is free. See the [Amazon CloudWatch pricing page](https://aws.amazon.com/cloudwatch/pricing/) for details.\n\nHaving a central point of view to monitor all the Amazon Web Services accounts that you use gives you a better understanding of your overall activities and helps solve issues for applications that span multiple accounts.\n\n[Start using CloudWatch cross-account observability to monitor all your resources.](https://aws.amazon.com/cloudwatch/)\n\n— [Danilo](https://twitter.com/danilop)\n\n\n\n\n### [Danilo Poccia](https://aws.amazon.com/blogs/aws/author/danilop/)\n\nDanilo works with startups and companies of any size to support their innovation. In his role as Chief Evangelist (EMEA) at Amazon Web Services, he leverages his experience to help people bring their ideas to life, focusing on serverless architectures and event-driven programming, and on the technical and business impact of machine learning and edge computing. He is the author of Amazon Web Services Lambda in Action from Manning.","render":"<p>Deploying applications using multiple Amazon Web Services accounts is a good practice to establish security and billing boundaries between teams and reduce the impact of operational events. When you adopt a multi-account strategy, you have to analyze telemetry data that is scattered across several accounts. To give you the flexibility to monitor all the components of your applications from a centralized view, we are introducing today<a href=\"https://aws.amazon.com/cloudwatch/\" target=\"_blank\"> Amazon CloudWatch </a><strong>cross-account observability</strong>, a new capability to search, analyze, and correlate cross-account telemetry data stored in CloudWatch such as metrics, logs, and traces.</p>\n<p>You can now set up a central monitoring Amazon Web Services account and connect your other accounts as sources. Then, you can search, audit, and analyze logs across your applications to drill down into operational issues in a matter of seconds. You can discover and visualize metrics from many accounts in a single place and create alarms that evaluate metrics belonging to other accounts. You can start with an aggregated cross-account view of your application to visually identify the resources exhibiting errors and dive deep into correlated traces, metrics, and logs to find the root cause. This seamless cross-account data access and navigation helps reduce the time and effort required to troubleshoot issues.</p>\n<p>Let’s see how this works in practice.</p>\n<p><strong><ins>Configuring CloudWatch Cross-Account Observability</ins></strong></p>\n<p>To enable cross-account observability, CloudWatch has introduced the concept of monitoring and source accounts:</p>\n<ul>\n<li>A <strong>monitoring account</strong> is a central Amazon Web Services account that can view and interact with observability data shared by other accounts.</li>\n<li>A <strong>source account</strong> is an individual Amazon Web Services account that shares observability data and resources with one or more monitoring accounts.</li>\n</ul>\n<p>You can configure multiple monitoring accounts with the level of visibility you need. CloudWatch cross-account observability is also integrated with <a href=\"https://aws.amazon.com/organizations/\" target=\"_blank\">Amazon Web Services Organizations.</a> For example, I can have a monitoring account with wide access to all accounts in my organization for central security and operational teams and then configure other monitoring accounts with more restricted visibility across a business unit for individual service owners.</p>\n<p>First, I configure the <strong>monitoring account</strong>. In the <a href=\"https://console.aws.amazon.com/cloudwatch\" target=\"_blank\">CloudWatch console</a>, I choose **Settings **in the navigation pane. In the <strong>Monitoring account configuration</strong> section, I choose <strong>Configure</strong>.</p>\n<p><img src=\"https://dev-media.amazoncloud.cn/c71cd50a96f74717857128fe8431f803_image.png\" alt=\"image.png\" /></p>\n<p>Now I can choose which telemetry data can be shared with the monitoring account: <strong>Logs</strong>, <strong>Metrics</strong>, and <strong>Traces</strong>. I leave all three enabled.</p>\n<p><img src=\"https://dev-media.amazoncloud.cn/8fa34571410845d08b10560ef2de67a5_image.png\" alt=\"image.png\" /></p>\n<p>To list the source accounts that will share data with this monitoring account, I can use account IDs, organization IDs, or organization paths. I can use an organization ID to include all the accounts in the organization or an organization path to include all the accounts in a department or business unit. In my case, I have only one source account to link, so I enter the account ID.</p>\n<p><img src=\"https://dev-media.amazoncloud.cn/5018f7ca8b61400abb1044b6e9bd7b46_image.png\" alt=\"image.png\" /></p>\n<p>When using the CloudWatch console in the monitoring account to search and display telemetry data, I see the account ID that shared that data. Because account IDs are not easy to remember, I can display a more descriptive “account label.” When configuring the label via the console, I can choose between the account name or the email address used to identify the account. When using an email address, I can also choose whether to include the domain. For example, if all the emails used to identify my accounts are using the same domain, I can use as labels the email addresses without that domain.</p>\n<p>There is a quick reminder that cross-account observability only works in the selected Region. If I have resources in multiple Regions, I can configure cross-account observability in each Region. To complete the configuration of the monitoring account, I choose <strong>Configure</strong>.</p>\n<p><img src=\"https://dev-media.amazoncloud.cn/15e597f61e2c46d0893af1aa70d9fe18_image.png\" alt=\"image.png\" /></p>\n<p>The monitoring account is now enabled, and I choose <strong>Resources to link accounts</strong> to determine how to link my source accounts.</p>\n<p><img src=\"https://dev-media.amazoncloud.cn/ebdfb74cebd24435b8e654ae4ca66389_image.png\" alt=\"image.png\" /></p>\n<p>To link source accounts in an <a href=\"https://aws.amazon.com/cloudformation/\" target=\"_blank\">Amazon Web Services organization</a>, I can download an Amazon Web Services CloudFormation template to be deployed in a CloudFormation delegated administration account.</p>\n<p>To link individual accounts, I can either download a CloudFormation template to be deployed in each account or copy a URL that helps me use the console to set up the accounts. I copy the URL and paste it into another browser where I am signed in as the source account. Then, I can configure which telemetry data to share (logs, metrics, or traces). The Amazon Resource Name (ARN) of the monitoring account configuration is pre-filled because I copy-pasted the URL in the previous step. If I don’t use the URL, I can copy the ARN from the monitoring account and paste it here. I confirm the label used to identify my source account and choose <strong>Link</strong>.</p>\n<p>In the <strong>Confirm monitoring account permission</strong> dialog, I type **Confirm **to complete the configuration of the source account.</p>\n<p><strong><ins>Using CloudWatch Cross-Account Observability</ins></strong></p>\n<p>To see how things work with cross-account observability, I deploy a simple cross-account application using two <a href=\"https://aws.amazon.com/lambda/\" target=\"_blank\">Amazon Web Services Lambda</a> functions, one in the source account (<code>multi-account-function-a</code>) and one in the monitoring account (<code>multi-account-function-b</code>). When triggered, the function in the source account publishes an event to an <a href=\"https://aws.amazon.com/eventbridge\" target=\"_blank\">Amazon EventBridge</a> event bus in the monitoring account. There, an EventBridge rule triggers the execution of the function in the monitoring account. This is a simplified setup using only two accounts. You’d probably have your workloads running in multiple source accounts.</p>\n<p><img src=\"https://dev-media.amazoncloud.cn/ecfe2b2c8f7447188f859c1ffda8e092_image.png\" alt=\"image.png\" /></p>\n<p>In the <a href=\"https://console.aws.amazon.com/lambda\" target=\"_blank\">Lambda console</a>, the two Lambda functions have <strong>Active tracing</strong> and <strong>Enhanced monitoring</strong> enabled. To collect telemetry data, I use the <a href=\"https://aws-otel.github.io/docs/getting-started/lambda\" target=\"_blank\">Amazon Web Services Distro for OpenTelemetry (ADOT) Lambda layer</a>. The Enhanced monitoring option turns on <a href=\"https://docs.aws.amazon.com/lambda/latest/dg/monitoring-insights.html\" target=\"_blank\">Amazon CloudWatch Lambda Insights</a> to collect and aggregate Lambda function runtime performance metrics.</p>\n<p><img src=\"https://dev-media.amazoncloud.cn/47b58decc79644fea5997d078dc7c562_image.png\" alt=\"image.png\" /></p>\n<p>I prepare a <a href=\"https://docs.aws.amazon.com/lambda/latest/dg/testing-functions.html\" target=\"_blank\">test event</a> in the Lambda console of the source account. Then, I choose **Test **and run the function a few times.</p>\n<p><img src=\"https://dev-media.amazoncloud.cn/c5051b0c6d1e426da55576468f49ce55_image.png\" alt=\"image.png\" /></p>\n<p>Now, I want to understand what the components of my application, running in different accounts, are doing. I start with logs and then move to metrics and traces.</p>\n<p>In the CloudWatch console of the <strong>monitoring account</strong>, I choose <strong>Log groups</strong> in the <strong>Logs</strong> section of the navigation pane. There, I search for and find the log groups created by the two Lambda functions running in different Amazon Web Services accounts. As expected, each log group shows the account ID and label originating the data. I select both log groups and choose <strong>View in Logs Insights</strong>.</p>\n<p><img src=\"https://dev-media.amazoncloud.cn/e75bac6a8cd449528c697d8d1883edc9_image.png\" alt=\"image.png\" /></p>\n<p>I can now search and analyze logs from different Amazon Web Services accounts using the <a href=\"https://docs.aws.amazon.com/AmazonCloudWatch/latest/logs/CWL_QuerySyntax.html\" target=\"_blank\">CloudWatch Logs Insights query syntax</a>. For example, I run a simple query to see the last twenty messages in the two log groups. I include the <code>@log</code> field to see the account ID that the log belongs to.</p>\n<p><img src=\"https://dev-media.amazoncloud.cn/4693ffe422f84f9993f2e3905061d533_image.png\" alt=\"image.png\" /></p>\n<p>I can now also create <a href=\"https://docs.aws.amazon.com/AmazonCloudWatch/latest/monitoring/ContributorInsights.html\" target=\"_blank\">Contributor Insights rules</a> on cross-account log groups. This enables me, for example, to have a holistic view of what security events are happening across accounts or identify the most expensive Lambda requests in a serverless application running in multiple accounts.</p>\n<p>Then, I choose <strong>All metrics</strong> in the <strong>Metrics</strong> section of the navigation pane. To see the Lambda function runtime performance metrics collected by CloudWatch Lambda Insights, I choose LambdaInsights and then function_name. There, I search for <code>multi-account</code> and <code>memory</code> to see the memory metrics. Again, I see the account IDs and labels that tell me that these metrics are coming from two different accounts. From here, I can just select the metrics I am interested in and create cross-account dashboards and alarms. With the metrics selected, I choose <strong>Add to dashboard</strong> in the <strong>Actions</strong> dropdown.</p>\n<p><img src=\"https://dev-media.amazoncloud.cn/9c6cb6835d95414fa4c6e4df6a931544_image.png\" alt=\"image.png\" /></p>\n<p>I create a new dashboard and choose the <strong>Stacked area</strong> widget type. Then, I choose <strong>Add to dashboard</strong>.</p>\n<p><img src=\"https://dev-media.amazoncloud.cn/d60724b402764c51a49707ccb15482d5_image.png\" alt=\"image.png\" /></p>\n<p>I do the same for the CPU and memory metrics (but using different widget types) to quickly create a <strong>cross-account dashboard</strong> where I can keep under control my multi-account setup. Well, there isn’t a lot of traffic yet but I am hopeful.</p>\n<p><img src=\"https://dev-media.amazoncloud.cn/d11ab145654744c7856ea715795f30a2_image.png\" alt=\"image.png\" /></p>\n<p>Finally, I choose <strong>Service map</strong> from the <strong>X-Ray traces</strong> section of the navigation pane to see the flow of my multi-account application. In the service map, the client triggers the Lambda function in the source account. Then, an event is sent to the other account to run the other Lambda function.</p>\n<p><img src=\"https://dev-media.amazoncloud.cn/06c556b6c6e341e39fa2c8f47bf97902_image.png\" alt=\"image.png\" /></p>\n<p>In the service map, I select the gear icon for the function running in the source account (<code>multi-account-function-a</code>) and then <strong>View traces</strong> to look at the individual traces. The traces contain data from multiple Amazon Web Services accounts. I can search for traces coming from a specific account using a syntax such as:</p>\n<pre><code class=\"lang-\">service(id(account.id: "123412341234"))\n</code></pre>\n<p><img src=\"https://dev-media.amazoncloud.cn/2b3a7563cd26439ca83d48859c8d7893_image.png\" alt=\"image.png\" /></p>\n<p>The service map now stitches together telemetry from multiple accounts in a single place, delivering a consolidated view to monitor their cross-account applications. This helps me to pinpoint issues quickly and reduces resolution time.</p>\n<p><strong><ins>Availability and Pricing</ins></strong></p>\n<p><a href=\"https://aws.amazon.com/cloudwatch/\" target=\"_blank\">Amazon CloudWatch </a>cross-account observability is available today in all commercial Amazon Web Services Regions using the <a href=\"https://console.aws.amazon.com/\" target=\"_blank\">Amazon Web Services Management Console</a>, <a href=\"https://aws.amazon.com/cli/\" target=\"_blank\">Amazon Web Services Command Line Interface (CLI)</a>, and <a href=\"https://aws.amazon.com/tools/\" target=\"_blank\">Amazon Web Services SDKs</a>.<a href=\"https://aws.amazon.com/cloudformation/\" target=\"_blank\"> Amazon Web Services CloudFormation</a> support is coming in the next few days. Cross-account observability in CloudWatch comes with no extra cost for logs and metrics, and the first trace copy is free. See the <a href=\"https://aws.amazon.com/cloudwatch/pricing/\" target=\"_blank\">Amazon CloudWatch pricing page</a> for details.</p>\n<p>Having a central point of view to monitor all the Amazon Web Services accounts that you use gives you a better understanding of your overall activities and helps solve issues for applications that span multiple accounts.</p>\n<p><a href=\"https://aws.amazon.com/cloudwatch/\" target=\"_blank\">Start using CloudWatch cross-account observability to monitor all your resources.</a></p>\n<p>— <a href=\"https://twitter.com/danilop\" target=\"_blank\">Danilo</a></p>\n<p><img src=\"https://dev-media.amazoncloud.cn/139729dd77e94661a64bb064e301c736_6465c675a51d44aca59965f281504693_image%281%29.png\" alt=\"6465c675a51d44aca59965f281504693_image1.png\" /></p>\n<h3><a id=\"Danilo_Pocciahttpsawsamazoncomblogsawsauthordanilop_109\"></a><a href=\"https://aws.amazon.com/blogs/aws/author/danilop/\" target=\"_blank\">Danilo Poccia</a></h3>\n<p>Danilo works with startups and companies of any size to support their innovation. In his role as Chief Evangelist (EMEA) at Amazon Web Services, he leverages his experience to help people bring their ideas to life, focusing on serverless architectures and event-driven programming, and on the technical and business impact of machine learning and edge computing. He is the author of Amazon Web Services Lambda in Action from Manning.</p>\n"}
New – Amazon CloudWatch Cross-Account Observability
海外精选
re:Invent
Amazon CloudWatch

海外精选的内容汇集了全球优质的亚马逊云科技相关技术内容。同时,内容中提到的“AWS”
是 “Amazon Web Services” 的缩写,在此网站不作为商标展示。

 0
0 0
0 相关产品
相关产品 相关产品
相关产品亚马逊云科技解决方案 基于行业客户应用场景及技术领域的解决方案
联系亚马逊云科技专家
亚马逊云科技解决方案
基于行业客户应用场景及技术领域的解决方案
联系专家

0
目录

 分享
分享 点赞
点赞 收藏
收藏 目录
目录立即注册,开启您的免费套餐
立即关注

亚马逊云开发者
公众号

User Group
公众号

亚马逊云科技
官方小程序
“AWS” 是 “Amazon Web Services” 的缩写,在此网站不作为商标展示。
立即关注
亚马逊云开发者
公众号
User Group
公众号
亚马逊云科技
官方小程序
“AWS” 是 “Amazon Web Services” 的缩写,在此网站不作为商标展示。
关于我们 
更多资源
开发者工具
更多支持
立即关注
亚马逊云开发者
公众号
User Group
公众号
亚马逊云科技
官方小程序
“AWS” 是 “Amazon Web Services” 的缩写,在此网站不作为商标展示。
