{"value":"How many times have you had monitoring dashboards show you a normal situation, and at the same time, you have received customer tickets reporting your app is “slow” or unavailable to them? How much time did it take to diagnose these customer reports?\n\nYou told us one of your challenges when monitoring internet-facing applications is to gather data outside of Amazon Web Services to build a realistic picture of how your application behaves for your customers connected to multiple and geographically distant internet providers. Capturing and monitoring data about internet traffic before it reaches your infrastructure is either difficult or very expensive.\n\nI am happy to announce the public preview of [Amazon CloudWatch Internet Monitor](https://aws.amazon.com/cloudwatch/features/), a new capability of CloudWatch that gives visibility into how an internet issue might impact the performance and availability of your applications. It allows you to reduce the time it takes to diagnose internet issues from days to minutes.\n\nInternet Monitor uses the connectivity data that we capture from our global networking footprint to calculate a baseline of performance and availability for internet traffic. This is the same data that we use at Amazon Web Services to monitor our own internet uptime and availability. With Internet Monitor, you can gain awareness of problems that arise on the internet experienced by your end users in different geographic locations and networks.\n\nThere is no need to instrument your application code. You can enable the service in the CloudWatch section of the [Amazon Web Services Management Console](https://console.aws.amazon.com/) and start to use it immediately.\n\n**++Let’s See It in Action++**\n\nGetting started with Internet Monitor is easy. Let’s imagine I want to monitor the network paths between my customers and my Amazon Web Services resources. I open the [Amazon Web Services Management Console](https://console.aws.amazon.com/) and navigate to CloudWatch. I select **Internet Monitor** on the left-side navigation menu. Then, I select **Create monitor.**\n\n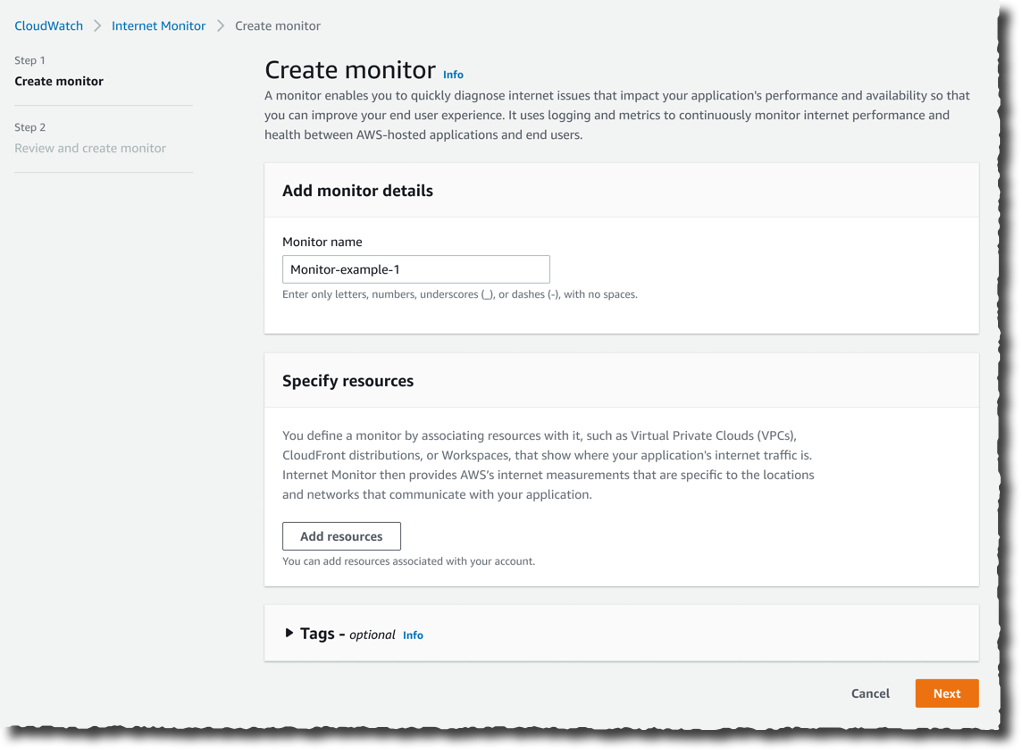\n\nOn the **Create monitor** page, I enter a **Monitor name**, and I select **Add resources** to choose the resources to monitor. For this demo, I select the VPC and the CloudFront distribution hosting my customer-facing application.\n\n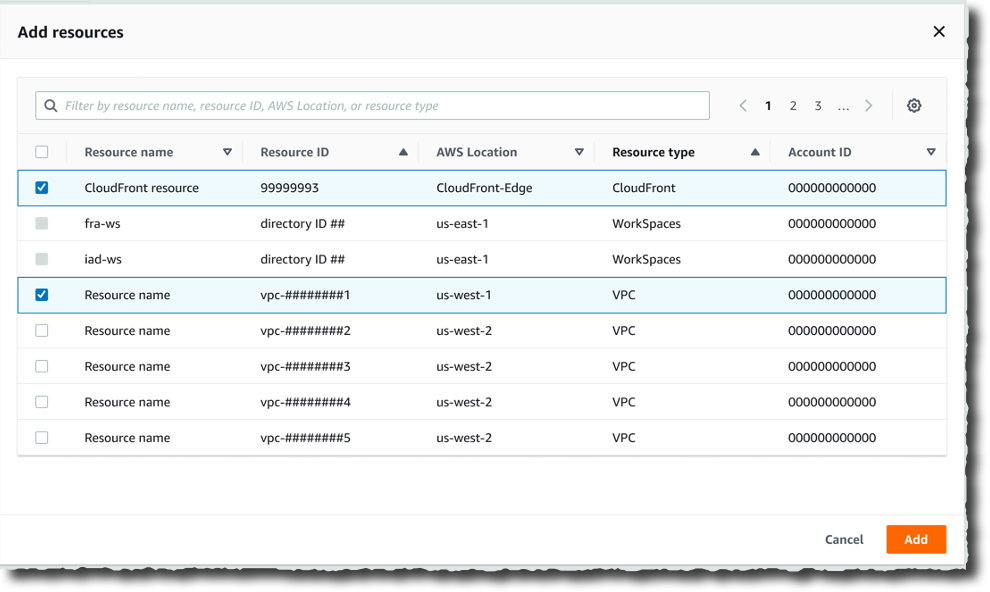\n\nI have the opportunity to review my choices. Then, I select **Create monitor**.\n\n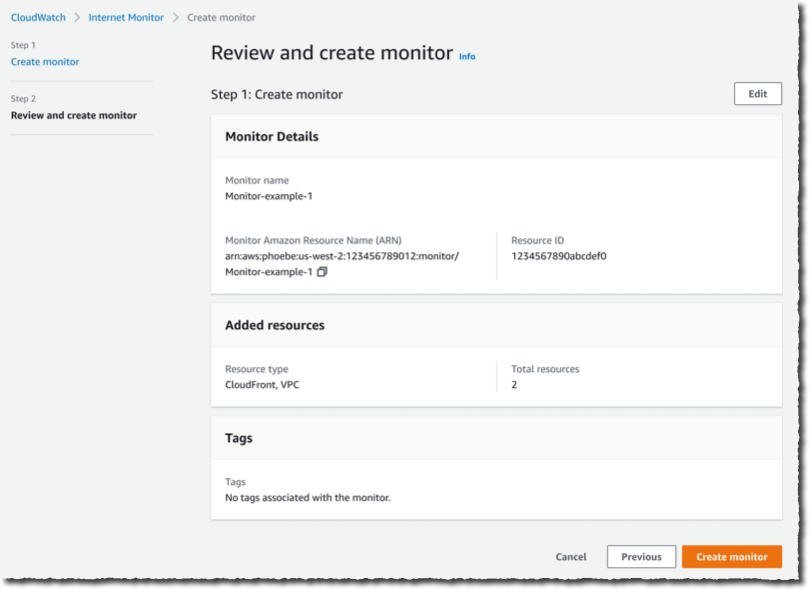\n\nFrom that moment on, Internet Monitor starts to collect data based on my application’s resource logs behind the scene. There is no need for you to activate (or pay for) [VPC Flow Logs](https://docs.aws.amazon.com/vpc/latest/userguide/flow-logs.html), [CloudFront logs](https://docs.aws.amazon.com/AmazonCloudFront/latest/DeveloperGuide/AccessLogs.html), or other log types.\n\nAfter a while, I receive customer complaints about our application being slow. I open Internet Monitor again, I select the monitor I created earlier (**Monitor_example**), and I immediately see that the application suffers from internet performance issues.\n\nThe **Health scores** graph shows you performance and availability information for your global traffic. Amazon Web Services has substantial historical data about internet performance and availability for network traffic between geographic locations for different network providers and services. By applying statistical analysis to the data, we can detect when the performance and availability towards your application have dropped, compared to an estimated baseline that we’ve calculated. To make it easier to see those drops, we report that information to you in the form of an estimated performance score and an availability score.\n\n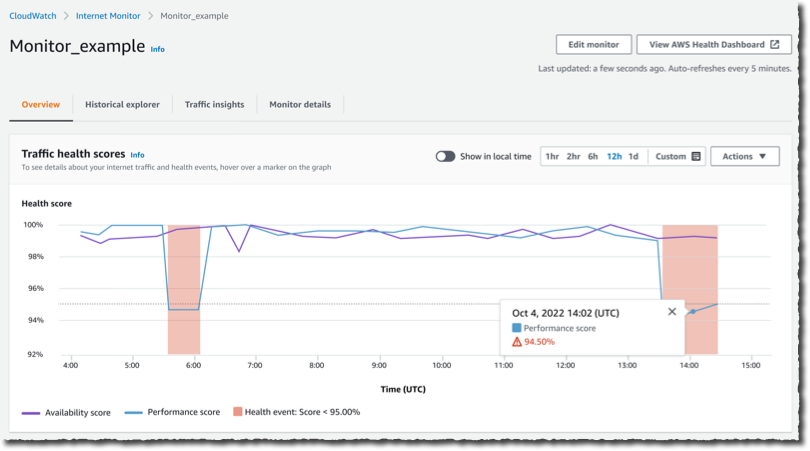\n\nI scroll a bit down the page. The **Internet traffic overview** map shows the overall event status across all monitored locations. I look at the details in the **Health events** table. It also highlights other events that are happening globally, sorted by total traffic impact. I notice that a performance issue in Las Vegas, Nevada, US, is affecting my application traffic the most.\n\n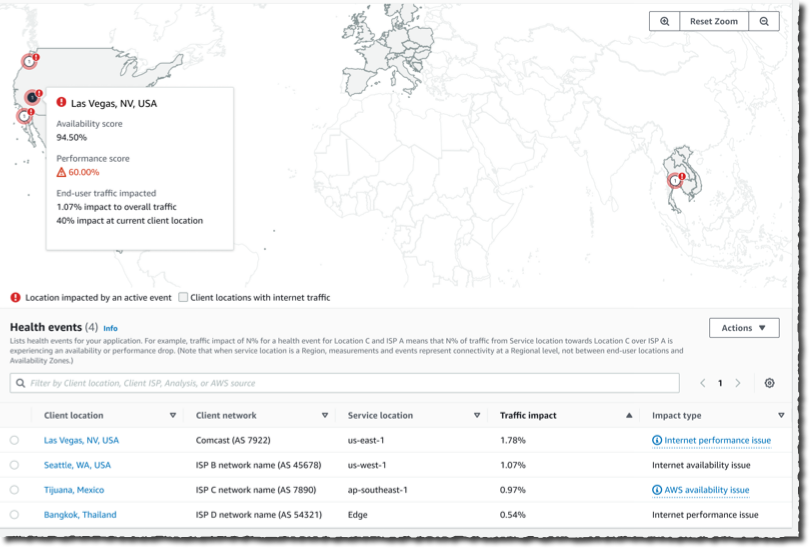\n\nNow that I have identified the issue, I am curious about the historical data. Has it happened before?\n\nI select the **Historical Explorer** tab to understand trends and see earlier data related to this location and network provider. I can view aggregated metrics such as performance score, availability score, bytes transferred, and round-trip time at p50, p90, and p95 percentiles, for a customized timeframe, up to 18 months in the past.\n\n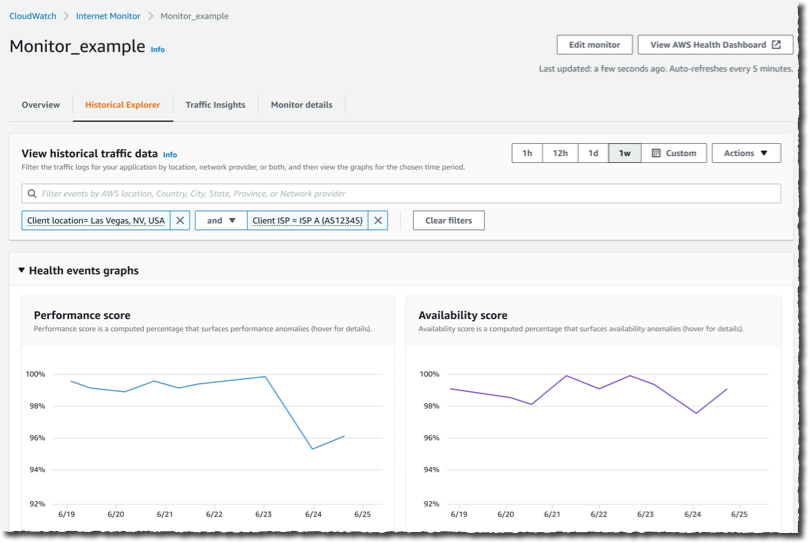\n\nI can see today’s incident is not the first one. This specific client location and network provider has had multiple issues in the past few months.\n\n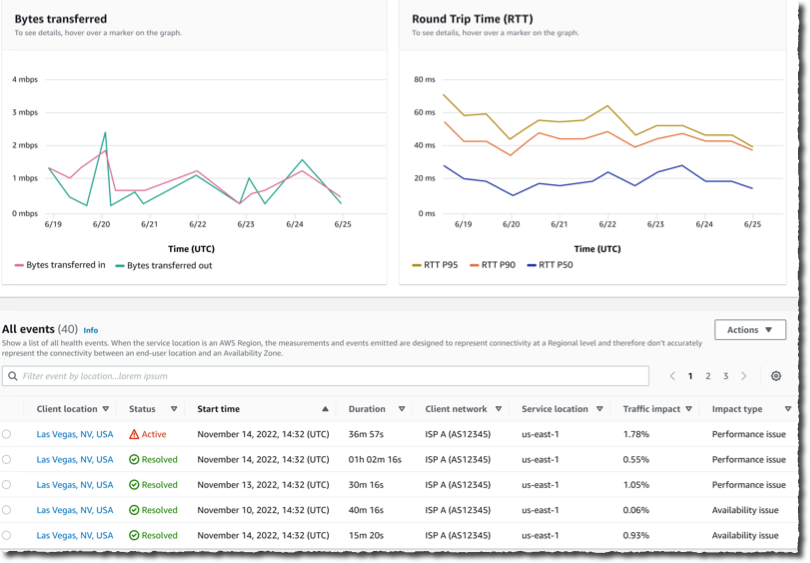\n\nNow that I understand the context, I wonder what action I can take to mitigate the issue.\n\nI switch to the **Traffic insights** tab. I see overall traffic data and top client locations that are being monitored based on total traffic (bytes). Apparently, Las Vegas, Nevada, US, is one of the top client locations.\n\n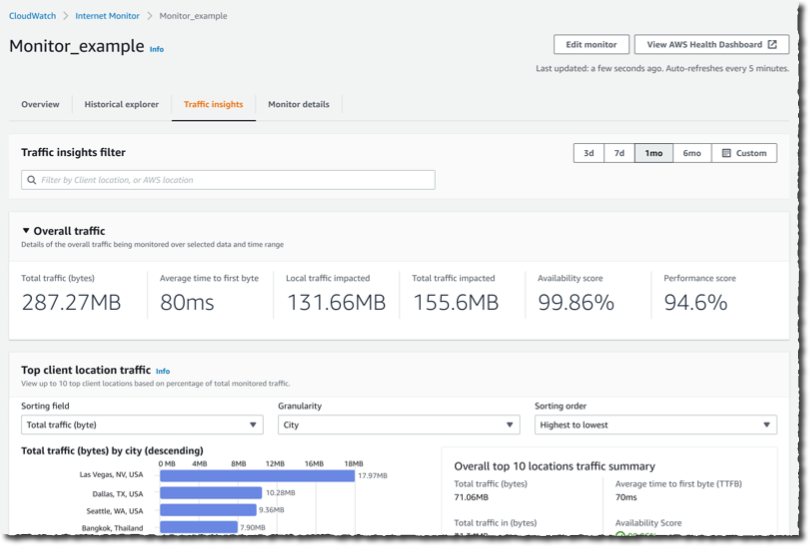\n\nI select the graph to see traffic details for Las Vegas, Nevada, US. In the **Lowest Time To First Byte (TTFB)** column, I see Amazon Web Services service and Amazon Web Services Region setup recommendations for all of the top client location and network combinations. The **Predicted Time To First Byte** in the table shows the potential impact if I make the suggested architectural change.\n\nIn this example, Internet Monitor suggests having CloudFront distribute the traffic currently distributed by EC2 and to allow for some additional traffic to be served by EC2 instances in us-east-1 in addition to us-east-2.\n\n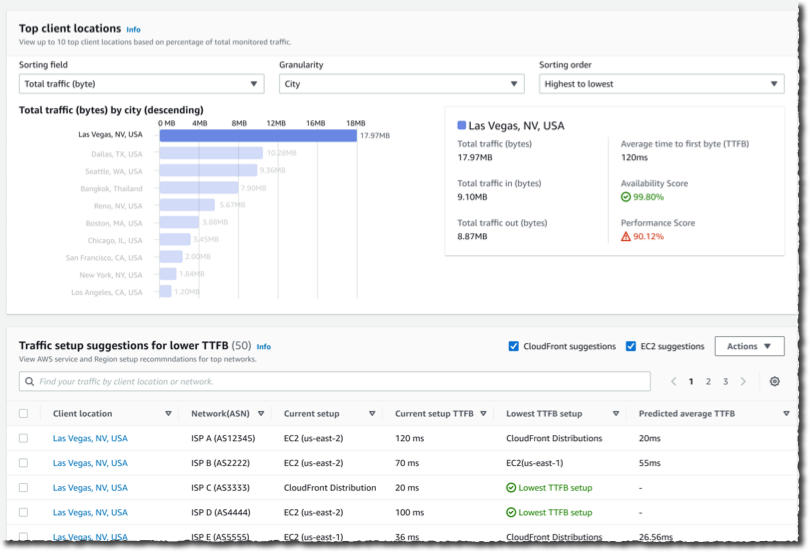\n\n**++Available Today++**\n\nInternet Monitor is available in public preview today in 20 Amazon Web Services Regions:\n\n- **In the Americas**: US East (Ohio), US East (N. Virginia), US West (N. California), US West (Oregon), Canada (Central), South America (São Paulo).\n- In **Asia and Pacific**: Asia Pacific (Hong Kong), Asia Pacific (Mumbai), Asia Pacific (Seoul), Asia Pacific (Singapore), Asia Pacific (Sydney), Asia Pacific (Tokyo).\n- In **Europe, Middle East, and Africa**: Africa (Cape Town), Europe (Frankfurt), Europe (Ireland), Europe (London), Europe (Milan), Europe (Paris), Europe (Stockholm), Middle East (Bahrain)\n\nNote that[ Amazon Web Services CloudFormatio](https://aws.amazon.com/cloudformation/)n support is missing at the moment; it will be added soon.\n\nThere is no costs associated with the service during the preview period. Just keep in mind that Internet Monitor vends metrics and logs to CloudWatch; you will be charged for these additional CloudWatch logs and CloudWatch metrics.\n\nWhether you work for a startup or a large enterprise, CloudWatch Internet Monitor helps you be proactive about your application performance and availability. [Give it a try today](https://aws.amazon.com/cloudwatch/features/)!\n\n-- [seb](https://twitter.com/sebsto)\n\n\n\n### [Sébastien Stormacq](https://aws.amazon.com/blogs/aws/author/stormacq/)\n\nSeb has been writing code since he first touched a Commodore 64 in the mid-eighties. He inspires builders to unlock the value of the Amazon Web Services cloud, using his secret blend of passion, enthusiasm, customer advocacy, curiosity and creativity. His interests are software architecture, developer tools and mobile computing. If you want to sell him something, be sure it has an API. Follow him on Twitter @sebsto.","render":"<p>How many times have you had monitoring dashboards show you a normal situation, and at the same time, you have received customer tickets reporting your app is “slow” or unavailable to them? How much time did it take to diagnose these customer reports?</p>\n<p>You told us one of your challenges when monitoring internet-facing applications is to gather data outside of Amazon Web Services to build a realistic picture of how your application behaves for your customers connected to multiple and geographically distant internet providers. Capturing and monitoring data about internet traffic before it reaches your infrastructure is either difficult or very expensive.</p>\n<p>I am happy to announce the public preview of <a href=\"https://aws.amazon.com/cloudwatch/features/\" target=\"_blank\">Amazon CloudWatch Internet Monitor</a>, a new capability of CloudWatch that gives visibility into how an internet issue might impact the performance and availability of your applications. It allows you to reduce the time it takes to diagnose internet issues from days to minutes.</p>\n<p>Internet Monitor uses the connectivity data that we capture from our global networking footprint to calculate a baseline of performance and availability for internet traffic. This is the same data that we use at Amazon Web Services to monitor our own internet uptime and availability. With Internet Monitor, you can gain awareness of problems that arise on the internet experienced by your end users in different geographic locations and networks.</p>\n<p>There is no need to instrument your application code. You can enable the service in the CloudWatch section of the <a href=\"https://console.aws.amazon.com/\" target=\"_blank\">Amazon Web Services Management Console</a> and start to use it immediately.</p>\n<p><strong><ins>Let’s See It in Action</ins></strong></p>\n<p>Getting started with Internet Monitor is easy. Let’s imagine I want to monitor the network paths between my customers and my Amazon Web Services resources. I open the <a href=\"https://console.aws.amazon.com/\" target=\"_blank\">Amazon Web Services Management Console</a> and navigate to CloudWatch. I select <strong>Internet Monitor</strong> on the left-side navigation menu. Then, I select <strong>Create monitor.</strong></p>\n<p><img src=\"https://dev-media.amazoncloud.cn/74e70856af9c4e80ab85fdc1511a15dd_image.png\" alt=\"image.png\" /></p>\n<p>On the <strong>Create monitor</strong> page, I enter a <strong>Monitor name</strong>, and I select <strong>Add resources</strong> to choose the resources to monitor. For this demo, I select the VPC and the CloudFront distribution hosting my customer-facing application.</p>\n<p><img src=\"https://dev-media.amazoncloud.cn/1fea35c2e7a0450c8abd196518f98982_image.png\" alt=\"image.png\" /></p>\n<p>I have the opportunity to review my choices. Then, I select <strong>Create monitor</strong>.</p>\n<p><img src=\"https://dev-media.amazoncloud.cn/5dcd460dc73146e69ce8d9575d1a7afd_image.png\" alt=\"image.png\" /></p>\n<p>From that moment on, Internet Monitor starts to collect data based on my application’s resource logs behind the scene. There is no need for you to activate (or pay for) <a href=\"https://docs.aws.amazon.com/vpc/latest/userguide/flow-logs.html\" target=\"_blank\">VPC Flow Logs</a>, <a href=\"https://docs.aws.amazon.com/AmazonCloudFront/latest/DeveloperGuide/AccessLogs.html\" target=\"_blank\">CloudFront logs</a>, or other log types.</p>\n<p>After a while, I receive customer complaints about our application being slow. I open Internet Monitor again, I select the monitor I created earlier (<strong>Monitor_example</strong>), and I immediately see that the application suffers from internet performance issues.</p>\n<p>The <strong>Health scores</strong> graph shows you performance and availability information for your global traffic. Amazon Web Services has substantial historical data about internet performance and availability for network traffic between geographic locations for different network providers and services. By applying statistical analysis to the data, we can detect when the performance and availability towards your application have dropped, compared to an estimated baseline that we’ve calculated. To make it easier to see those drops, we report that information to you in the form of an estimated performance score and an availability score.</p>\n<p><img src=\"https://dev-media.amazoncloud.cn/f1fae6431fd247c88cb8c8290ab899a7_image.png\" alt=\"image.png\" /></p>\n<p>I scroll a bit down the page. The <strong>Internet traffic overview</strong> map shows the overall event status across all monitored locations. I look at the details in the <strong>Health events</strong> table. It also highlights other events that are happening globally, sorted by total traffic impact. I notice that a performance issue in Las Vegas, Nevada, US, is affecting my application traffic the most.</p>\n<p><img src=\"https://dev-media.amazoncloud.cn/eb1d9168bab34532868d7349adf7670b_image.png\" alt=\"image.png\" /></p>\n<p>Now that I have identified the issue, I am curious about the historical data. Has it happened before?</p>\n<p>I select the <strong>Historical Explorer</strong> tab to understand trends and see earlier data related to this location and network provider. I can view aggregated metrics such as performance score, availability score, bytes transferred, and round-trip time at p50, p90, and p95 percentiles, for a customized timeframe, up to 18 months in the past.</p>\n<p><img src=\"https://dev-media.amazoncloud.cn/7f92dc74dace4a1995b2e4cbe4683234_image.png\" alt=\"image.png\" /></p>\n<p>I can see today’s incident is not the first one. This specific client location and network provider has had multiple issues in the past few months.</p>\n<p><img src=\"https://dev-media.amazoncloud.cn/496a14cec981464da67f79099dd1140c_image.png\" alt=\"image.png\" /></p>\n<p>Now that I understand the context, I wonder what action I can take to mitigate the issue.</p>\n<p>I switch to the <strong>Traffic insights</strong> tab. I see overall traffic data and top client locations that are being monitored based on total traffic (bytes). Apparently, Las Vegas, Nevada, US, is one of the top client locations.</p>\n<p><img src=\"https://dev-media.amazoncloud.cn/5bb52f13d7e24faa9fa7e8ba68873b48_image.png\" alt=\"image.png\" /></p>\n<p>I select the graph to see traffic details for Las Vegas, Nevada, US. In the <strong>Lowest Time To First Byte (TTFB)</strong> column, I see Amazon Web Services service and Amazon Web Services Region setup recommendations for all of the top client location and network combinations. The <strong>Predicted Time To First Byte</strong> in the table shows the potential impact if I make the suggested architectural change.</p>\n<p>In this example, Internet Monitor suggests having CloudFront distribute the traffic currently distributed by EC2 and to allow for some additional traffic to be served by EC2 instances in us-east-1 in addition to us-east-2.</p>\n<p><img src=\"https://dev-media.amazoncloud.cn/73e48bd9c1964ebebd98b0070b2221fe_image.png\" alt=\"image.png\" /></p>\n<p><strong><ins>Available Today</ins></strong></p>\n<p>Internet Monitor is available in public preview today in 20 Amazon Web Services Regions:</p>\n<ul>\n<li><strong>In the Americas</strong>: US East (Ohio), US East (N. Virginia), US West (N. California), US West (Oregon), Canada (Central), South America (São Paulo).</li>\n<li>In <strong>Asia and Pacific</strong>: Asia Pacific (Hong Kong), Asia Pacific (Mumbai), Asia Pacific (Seoul), Asia Pacific (Singapore), Asia Pacific (Sydney), Asia Pacific (Tokyo).</li>\n<li>In <strong>Europe, Middle East, and Africa</strong>: Africa (Cape Town), Europe (Frankfurt), Europe (Ireland), Europe (London), Europe (Milan), Europe (Paris), Europe (Stockholm), Middle East (Bahrain)</li>\n</ul>\n<p>Note that<a href=\"https://aws.amazon.com/cloudformation/\" target=\"_blank\"> Amazon Web Services CloudFormatio</a>n support is missing at the moment; it will be added soon.</p>\n<p>There is no costs associated with the service during the preview period. Just keep in mind that Internet Monitor vends metrics and logs to CloudWatch; you will be charged for these additional CloudWatch logs and CloudWatch metrics.</p>\n<p>Whether you work for a startup or a large enterprise, CloudWatch Internet Monitor helps you be proactive about your application performance and availability. <a href=\"https://aws.amazon.com/cloudwatch/features/\" target=\"_blank\">Give it a try today</a>!</p>\n<p>– <a href=\"https://twitter.com/sebsto\" target=\"_blank\">seb</a></p>\n<p><img src=\"https://dev-media.amazoncloud.cn/4745ae35c33f42c290b2a015dd76bc1c_image.png\" alt=\"image.png\" /></p>\n<h3><a id=\"Sbastien_Stormacqhttpsawsamazoncomblogsawsauthorstormacq_76\"></a><a href=\"https://aws.amazon.com/blogs/aws/author/stormacq/\" target=\"_blank\">Sébastien Stormacq</a></h3>\n<p>Seb has been writing code since he first touched a Commodore 64 in the mid-eighties. He inspires builders to unlock the value of the Amazon Web Services cloud, using his secret blend of passion, enthusiasm, customer advocacy, curiosity and creativity. His interests are software architecture, developer tools and mobile computing. If you want to sell him something, be sure it has an API. Follow him on Twitter @sebsto.</p>\n"}
Amazon CloudWatch Internet Monitor Provides End-to-End Visibility into Internet Performance for your Applications (Preview)
海外精选
re:Invent
Amazon CloudWatch

海外精选的内容汇集了全球优质的亚马逊云科技相关技术内容。同时,内容中提到的“AWS”
是 “Amazon Web Services” 的缩写,在此网站不作为商标展示。

 0
0 0
0 相关产品
相关产品 相关产品
相关产品亚马逊云科技解决方案 基于行业客户应用场景及技术领域的解决方案
联系亚马逊云科技专家
亚马逊云科技解决方案
基于行业客户应用场景及技术领域的解决方案
联系专家

0
目录

 分享
分享 点赞
点赞 收藏
收藏 目录
目录立即注册,开启您的免费套餐
立即关注

亚马逊云开发者
公众号

User Group
公众号

亚马逊云科技
官方小程序
“AWS” 是 “Amazon Web Services” 的缩写,在此网站不作为商标展示。
立即关注
亚马逊云开发者
公众号
User Group
公众号
亚马逊云科技
官方小程序
“AWS” 是 “Amazon Web Services” 的缩写,在此网站不作为商标展示。
关于我们 
更多资源
开发者工具
更多支持
立即关注
亚马逊云开发者
公众号
User Group
公众号
亚马逊云科技
官方小程序
“AWS” 是 “Amazon Web Services” 的缩写,在此网站不作为商标展示。
