{"value":"[Amazon QuickSight](https://aws.amazon.com/quicksight/) is a serverless business intelligence (BI) service used by organizations of any size to make better data-driven decisions. QuickSight dashboards can also be embedded into SaaS apps and web portals to provide interactive dashboards, natural language query or data analysis capabilities to app users seamlessly. The [QuickSight Demo Central](https://democentral.learnquicksight.online/#) contains many dashboards, feature showcase and tips and tricks that you can use; in the [QuickSight Embedded Analytics Developer Portal](https://developer.quicksight.aws/embedSample/dashboard#/embed-url-in-your-application) you can find details on how to embed dashboards in your applications.\n\nThe QuickSight user interface currently supports 15 languages that [you can choose](https://docs.aws.amazon.com/quicksight/latest/user/choosing-a-language-in-quicksight.html) on a per-user basis. The language selected for the user interface localizes all text generated by QuickSight with respect to UI components and isn’t applied to the data displayed in the dashboards.\n\nThis post describes how to create multilingual dashboards at the data level by creating new columns that contain the translated text and providing a language selection parameter and associated control to display data in the selected language in a QuickSight dashboard. You can create new columns with the translated text in several ways; in this post we create new columns using [\\nAmazon Athena](https://aws.amazon.com/athena/) user-defined functions implemented in the GitHub project sample [Amazon Athena UDFs for text translation and analytics using Amazon Comprehend and Amazon Translate](https://github.com/aws-samples/aws-athena-udfs-textanalytics). This approach makes it easy to automatically create columns with translated text using neural machine translation provided by [Amazon Translate](https://aws.amazon.com/translate/).\n\n#### **Solution overview**\nThe following diagram illustrates the architecture of this solution.\n\n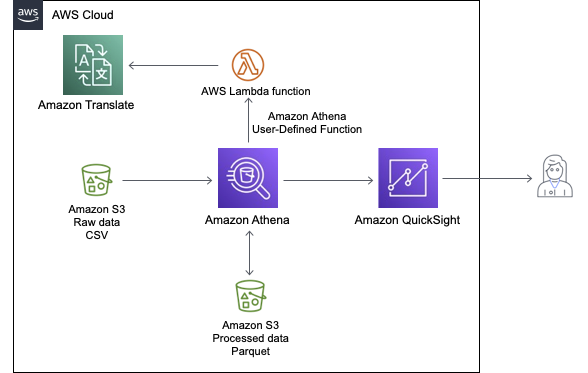\n\nFor this post, we use the sample [SaaS-Sales.csv](https://ee-assets-prod-us-east-1.s3.amazonaws.com/modules/337d5d05acc64a6fa37bcba6b921071c/v1/SaaS-Sales.csv) dataset and follow these steps:\n\n1. [Copy](https://docs.aws.amazon.com/AmazonS3/latest/userguide/upload-objects.html) the dataset to a bucket in [Amazon Simple Storage Service](https://aws.amazon.com/s3/) ([Amazon S3](https://aws.amazon.com/cn/s3/?trk=cndc-detail)).\n2. Use Athena to define a database and table to read the CSV file.\n3. Create a new table in Parquet format with the columns with the translated text.\n4. Create a new dataset in QuickSight.\n5. Create the parameter and control to select the language.\n6. Create dynamic multilingual calculated fields.\n7. Create an analysis with calculated multilingual calculated fields.\n8. Publish the multilingual dashboard.\n9. Create parametric headers and titles for visuals for use in an embedded dashboard.\n\nAn alternative approach might be to directly [upload the CSV](https://docs.aws.amazon.com/quicksight/latest/user/choosing-file-upload-settings.html) dataset to QuickSight and create the new columns with translated text as QuickSight [calculated fields](https://docs.aws.amazon.com/quicksight/latest/user/working-with-calculated-fields.html), for example using the [ifelse() conditional function](https://docs.aws.amazon.com/quicksight/latest/user/ifelse-function.html) to directly assign the translated values.\n\n#### **Prerequisites**\nTo follow the steps in this post, you need to have an AWS account with an active QuickSight Standard Edition or Enterprise Edition [subscription](https://docs.aws.amazon.com/quicksight/latest/user/signing-up.html).\n\n#### **Copy the dataset to a bucket in [Amazon S3](https://aws.amazon.com/cn/s3/?trk=cndc-detail)**\nUse the [AWS Command Line Interface (AWS CLI)](https://aws.amazon.com/cli/) to create the S3 bucket ```qs-ml-blog-data``` and copy the dataset under the prefix ```saas-sales``` in your AWS account. You must follow the [bucket naming rules](https://docs.aws.amazon.com/AmazonS3/latest/userguide/bucketnamingrules.html) to create your bucket. See the following code:\n\nBash\n```\\n\$ MY_BUCKET=qs-ml-blog-data\\n\$ PREFIX=saas-sales\\n\\n\$ aws s3 mb s3://\${MY_BUCKET}/\\n\\n\$ aws s3 cp \\\\\\n \\"s3://ee-assets-prod-us-east-1/modules/337d5d05acc64a6fa37bcba6b921071c/v1/SaaS-Sales.csv\\" \\\\\\n \\"s3://\${MY_BUCKET}/\${PREFIX}/SaaS-Sales.csv\\"\\n```\n#### **Define a database and table to read the CSV file**\nUse the Athena query editor to create the database ```qs_ml_blog_db```:\n\nSQL\n```\\nCREATE DATABASE IF NOT EXISTS qs_ml_blog_db;\\n```\nThen create the new table ```qs_ml_blog_db.saas_sales```:\n\nSQL\n```\\nCREATE EXTERNAL TABLE IF NOT EXISTS qs_ml_blog_db.saas_sales (\\n row_id bigint, \\n order_id string, \\n order_date string, \\n date_key bigint, \\n contact_name string, \\n country_en string, \\n city_en string, \\n region string, \\n subregion string, \\n customer string, \\n customer_id bigint, \\n industry_en string, \\n segment string, \\n product string, \\n license string, \\n sales double, \\n quantity bigint, \\n discount double, \\n profit double)\\nROW FORMAT DELIMITED \\n FIELDS TERMINATED BY ',' \\nSTORED AS INPUTFORMAT \\n 'org.apache.hadoop.mapred.TextInputFormat' \\nOUTPUTFORMAT \\n 'org.apache.hadoop.hive.ql.io.HiveIgnoreKeyTextOutputFormat'\\nLOCATION\\n 's3://<MY_BUCKET>/saas-sales/'\\nTBLPROPERTIES (\\n 'areColumnsQuoted'='false', \\n 'classification'='csv', \\n 'columnsOrdered'='true', \\n 'compressionType'='none', \\n 'delimiter'=',', \\n 'skip.header.line.count'='1', \\n 'typeOfData'='file')\\n```\n#### **Create a new table in Parquet format with the columns with the translated text**\nWe want to translate the columns ```country_en```, ```city_en```, and ```industry_en``` to German, Spanish, and Italian. To do this in a scalable and flexible way, we use the GitHub project sample [Amazon Athena UDFs for text translation and analytics using Amazon Comprehend and Amazon Translate](https://github.com/aws-samples/aws-athena-udfs-textanalytics).\n\nAfter you set up the user-defined functions following the instructions in the [GitHub repo](https://github.com/aws-samples/aws-athena-udfs-textanalytics/blob/main/athena-udfs-textanalytics/README.md), run the following SQL query in Athena to create the new table ```qs_ml_blog_db.saas_sales_ml``` with the translated columns using the ```translate_text``` user-defined function and some other minor changes:\n\nSQL\n```\\nCREATE TABLE qs_ml_blog_db.saas_sales_ml WITH (\\n format = 'PARQUET',\\n parquet_compression = 'SNAPPY',\\n external_location = 's3://<MY_BUCKET>/saas-sales-ml/'\\n) AS \\nUSING EXTERNAL FUNCTION translate_text(text_col VARCHAR, sourcelang VARCHAR, targetlang VARCHAR, terminologyname VARCHAR) RETURNS VARCHAR LAMBDA 'textanalytics-udf'\\nSELECT \\nrow_id,\\norder_id,\\ndate_parse(\\"order_date\\",'%m/%d/%Y') as order_date,\\ndate_key,\\ncontact_name,\\ncountry_en,\\ntranslate_text(country_en, 'en', 'de', NULL) as country_de,\\ntranslate_text(country_en, 'en', 'es', NULL) as country_es,\\ntranslate_text(country_en, 'en', 'it', NULL) as country_it,\\ncity_en,\\ntranslate_text(city_en, 'en', 'de', NULL) as city_de,\\ntranslate_text(city_en, 'en', 'es', NULL) as city_es,\\ntranslate_text(city_en, 'en', 'it', NULL) as city_it,\\nregion,\\nsubregion,\\ncustomer,\\ncustomer_id,\\nindustry_en,\\ntranslate_text(industry_en, 'en', 'de', NULL) as industry_de,\\ntranslate_text(industry_en, 'en', 'es', NULL) as industry_es,\\ntranslate_text(industry_en, 'en', 'it', NULL) as industry_it,\\nsegment,\\nproduct,\\nlicense,\\nsales,\\nquantity,\\ndiscount,\\nprofit\\nFROM qs_ml_blog_db.saas_sales\\n;\\n```\nRun three simple queries, one per column, to check the generation of the new columns with the translation was successful. We include a screenshot after each query showing its results.\n\nSQL\n```\\nSELECT \\ndistinct(country_en),\\ncountry_de,\\ncountry_es,\\ncountry_it\\nFROM qs_ml_blog_db.saas_sales_ml \\nORDER BY country_en\\nlimit 10\\n;\\nSQL\\n```\n\n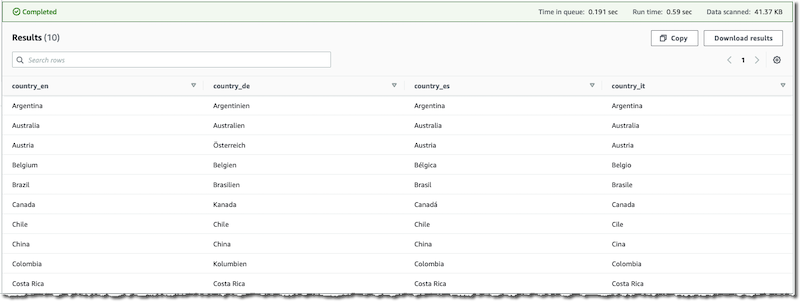\n\nSQL\n```\\nSELECT \\ndistinct(city_en),\\ncity_de,\\ncity_es,\\ncity_it\\nFROM qs_ml_blog_db.saas_sales_ml \\nORDER BY city_en\\nlimit 10\\n;\\n```\n\n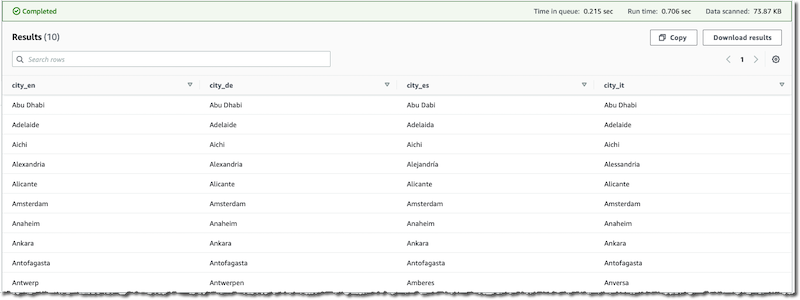\n\nSQL\n```\\nSELECT \\ndistinct(industry_en),\\nindustry_de,\\nindustry_es,\\nindustry_it\\nFROM qs_ml_blog_db.saas_sales_ml \\nORDER BY industry_en\\nlimit 10\\n;\\n```\n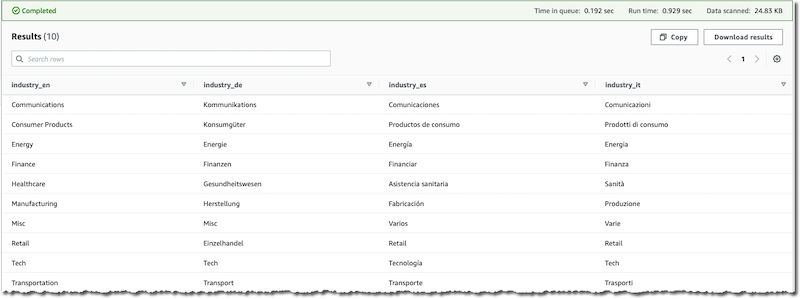\n\nNow you can use the new table ```saas_sales_ml``` as input to create a dataset in QuickSight.\n\n#### **Create a dataset in QuickSight**\nTo create your dataset in QuickSight, complete the following steps:\n\n1. On the QuickSight console, choose **Datasets** in the navigation pane.\n2. Choose **Create a dataset**.\n3. Choose **Athena**.\n4. For **Data source name**¸ enter ```athena_primary```.\n5. For **Athena workgroup**¸ choose **primary**.\n6. Choose **Create data source**.\n\n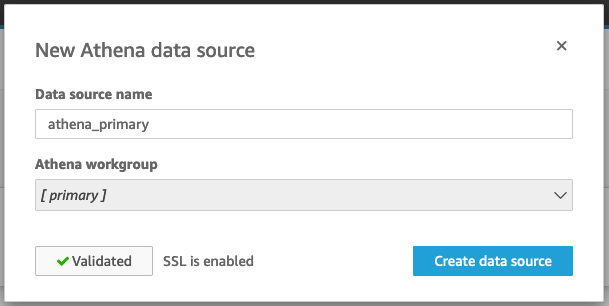\n\n7.Select the ```saas_sales_ml``` table previously created and choose **Select**.\n\n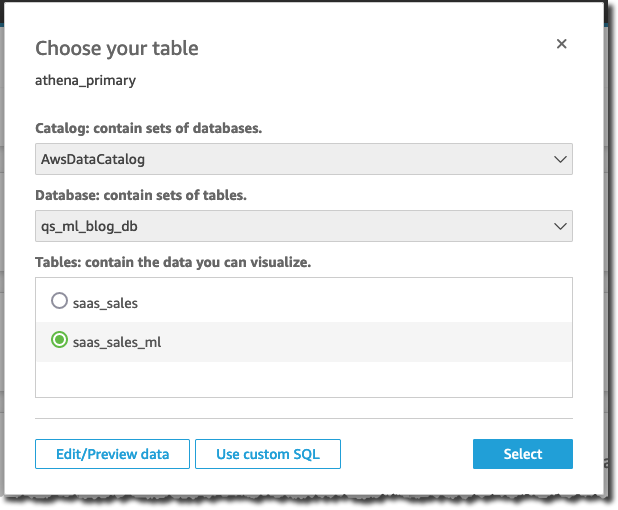\n\n8.Choose to import the table to SPICE and choose Visualize to start creating the new dashboard.\n\n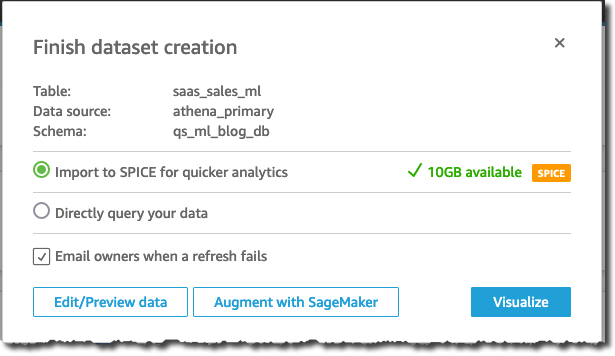\n\nIn the analysis section, you receive a message that informs you that the table was successfully imported to SPICE.\n\n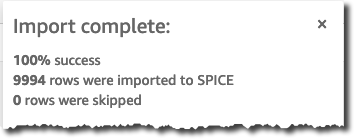\n\n#### **Create the parameter and control to select the language**\nTo create the parameter and associate the control that you use to select the language for the dashboard, complete the following steps:\n\n1. In the analysis section, choose **Parameters** and **Create one**.\n2. For **Name**, enter ```Language```.\n3. For **Data type**, choose **String**.\n4. For **Values**, select **Single value**.\n5. For **Static default value**, enter ```English```.\n6. Choose **Create**.\n\n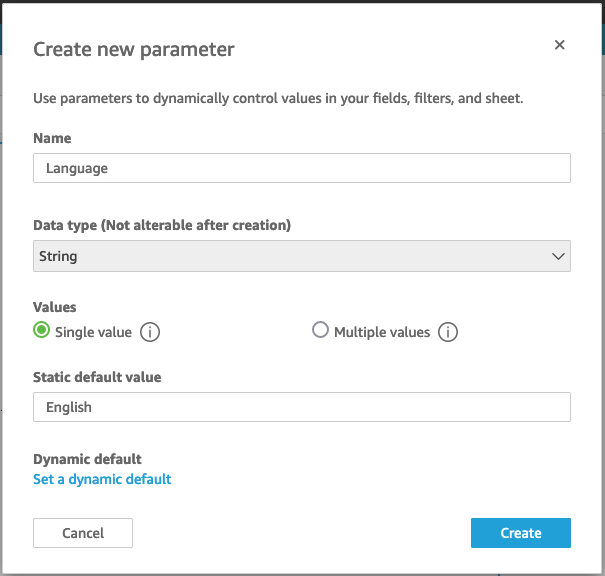\n\n7.To connect the parameter to a control, choose **Control**.\n\n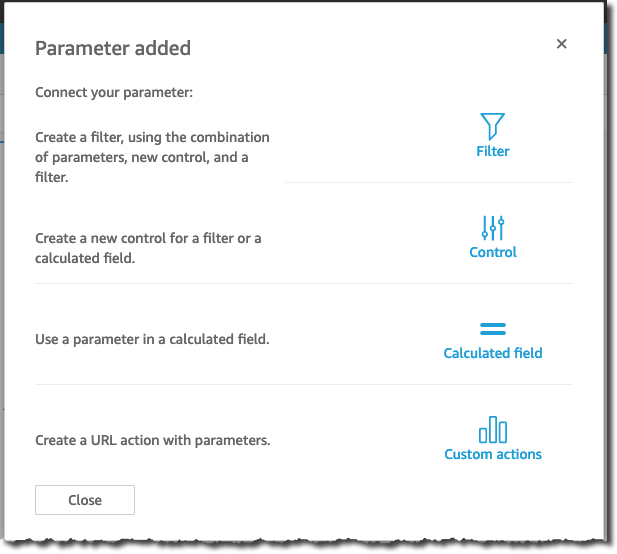\n\n8.For **Display name**, choose **Language**.\n9.For **Style**, choose **Dropdown**.\n10.For **Values**, select **Specific values**.\n11.For **Define specific values**, enter ```English```, ```German```, ```Italian```, and ```French``` (one value per line).\n12.Select **Hide Select all option from the control values if the parameter has a default configured**.\n13.Choose **Add**.\n\n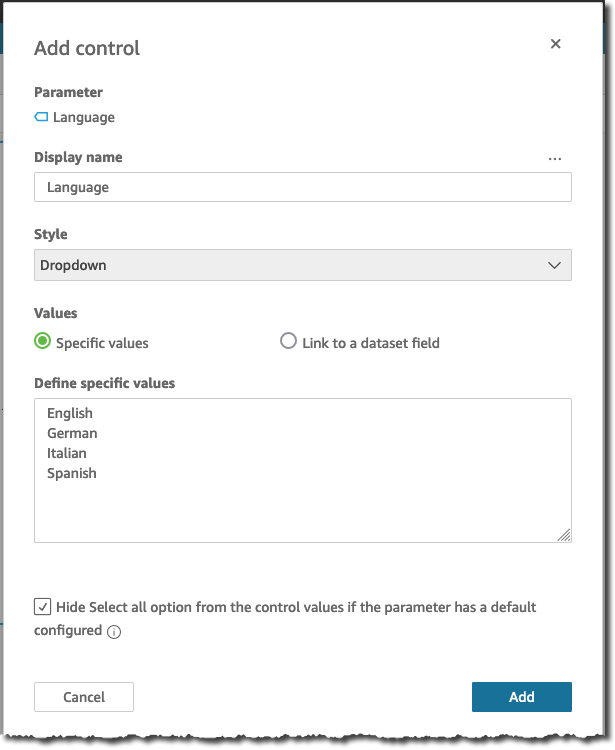\n\nThe control is now available, linked to the parameter and displayed in the **Controls** section of the current sheet in the analysis.\n\n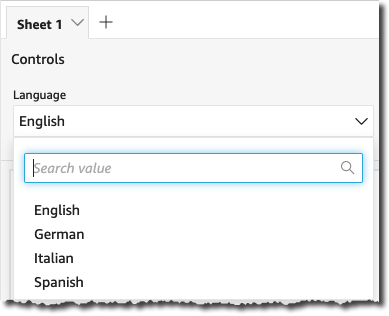\n\n#### **Create dynamic multilingual calculated fields**\nYou’re now ready to create the calculated fields whose value will change based on the currently selected language.\n\n1. In the menu bar, choose **Add** and choose **Add calculated field**.\n\n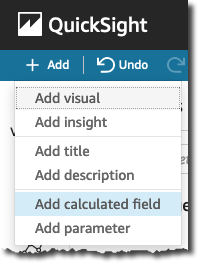\n\n2. Use the [ifelse conditional function](https://docs.aws.amazon.com/quicksight/latest/user/ifelse-function.html) to evaluate the value of the ```Language``` parameter and select the correct column in the dataset to assign the value to the calculated field.\n3. Create the ```Country``` calculated field using the following expression:\n```\\nifelse(\\n \${Language} = 'English', {country_en},\\n \${Language} = 'German', {country_de},\\n \${Language} = 'Italian', {country_it},\\n \${Language} = 'Spanish', {country_es},\\n {country_en}\\n)\\n```\n4. Choose **Save**.\n\n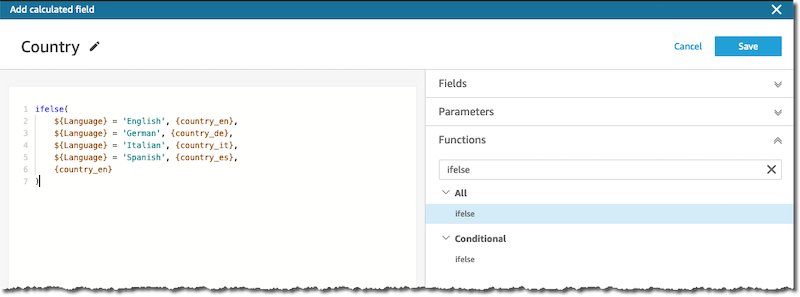\n\n5. Repeat the process for the ```City``` calculated field:\n```\\nifelse(\\n \${Language} = 'English', {city_en},\\n \${Language} = 'German', {city_de},\\n \${Language} = 'Italian', {city_it},\\n \${Language} = 'Spanish', {city_es},\\n {city_en}\\n)\\n```\n6. Repeat the process for the ```Industry``` calculated field:\n```\\nifelse(\\n \${Language} = 'English', {industry_en},\\n \${Language} = 'German', {industry_de},\\n \${Language} = 'Italian', {industry_it},\\n \${Language} = 'Spanish', {industry_es},\\n {industry_en}\\n)\\n```\nThe calculated fields are now available and ready to use in the analysis.\n\n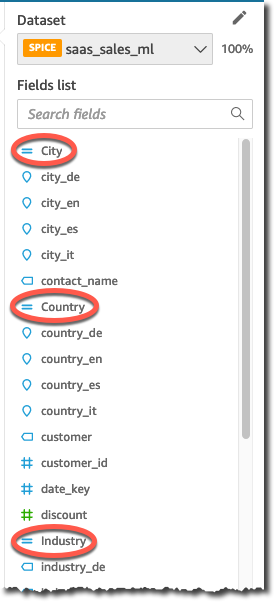\n\n#### **Create an analysis with calculated multilingual calculated fields**\nCreate an analysis with two [donut charts](https://docs.aws.amazon.com/quicksight/latest/user/donut-chart.html) and a [pivot table](https://docs.aws.amazon.com/quicksight/latest/user/pivot-table.html) that use the three multilingual fields. In the subtitle of the visuals, use the string ```Language: <<\$Language>>``` to display the currently selected language. The following screenshot shows our analysis.\n\n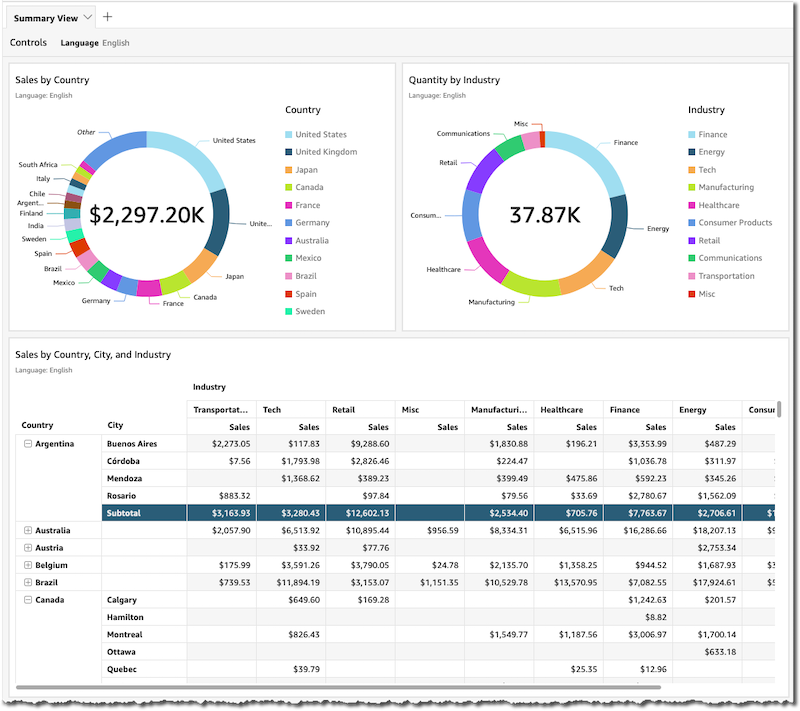\n\nIf you choose a new language from the **Language** control, the visuals adapt accordingly. The following screenshot shows the analysis in Italian.\n\n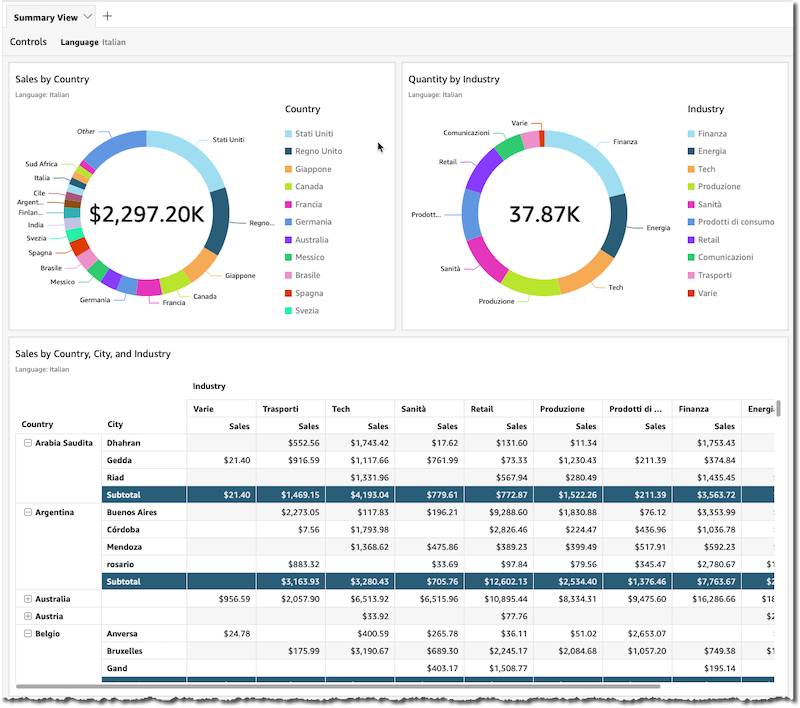\n\nYou’re now ready to publish the analysis as a dashboard.\n\n#### **Publish the multilingual dashboard**\nIn the menu bar, choose **Share** and **Publish dashboard**.\n\n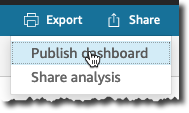\n\nPublish the new dashboard as “Multilingual dashboard,” leave the advanced publish options at their default values, and **choose Publish dashboard**.\n\n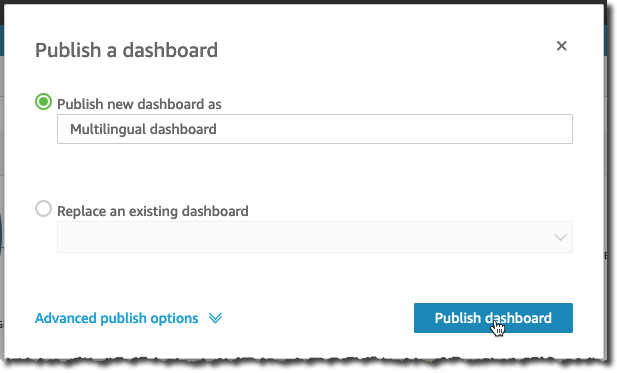\n\nThe dashboard is now ready.\n\n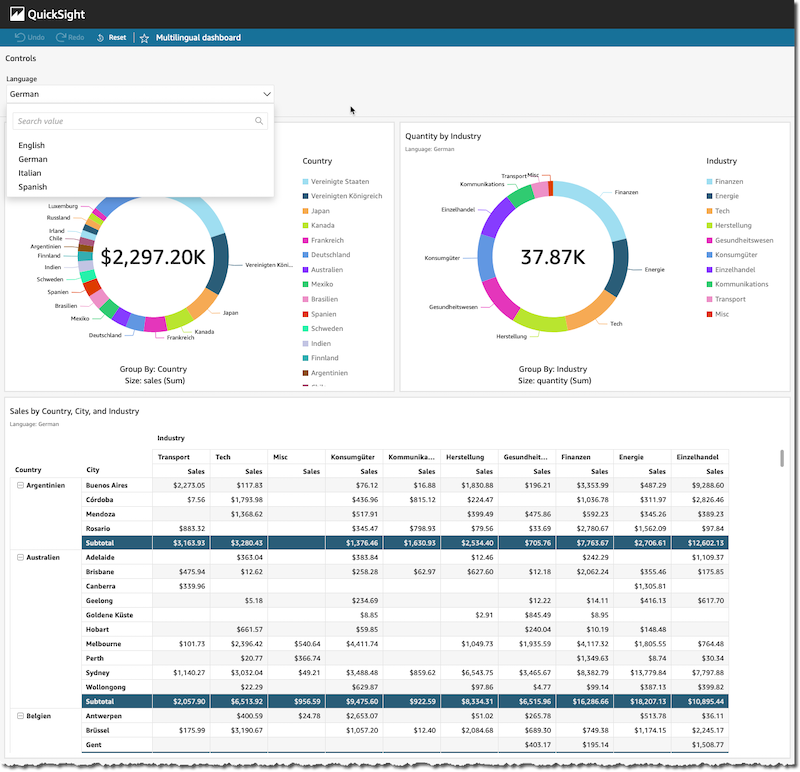\n\nWe can take the multilingual features one step further by embedding the dashboard and controlling the parameters in the external page using the [Amazon QuickSight Embedding SDK](https://github.com/awslabs/amazon-quicksight-embedding-sdk).\n\n#### **Create parametric headers and titles for visuals for use in an embedded dashboard**\n\nWhen [embedding an QuickSight dashboard](https://docs.aws.amazon.com/quicksight/latest/user/embedded-analytics.html), the [locale](https://github.com/awslabs/amazon-quicksight-embedding-sdk#locale-element-optional) and parameters’ values can be [set programmatically from JavaScript](https://github.com/awslabs/amazon-quicksight-embedding-sdk#step-6-update-parameter-values-optional). This can be useful to set default values and change the settings for localization and the default data language. The following steps show how to use these features by modifying the dashboard we have created so far, embedding it in an HTML page, and using the [Amazon QuickSight Embedding SDK](https://github.com/awslabs/amazon-quicksight-embedding-sdk) to dynamically set the value of parameters used to display titles, legends, headers, and more in translated text. The full code for the HTML page is also provided in the appendix of this post.\n\nCreate new parameters for the titles and the headers of the visuals in the analysis, the sheet name, visuals legends, and control labels as per the following table.\n\n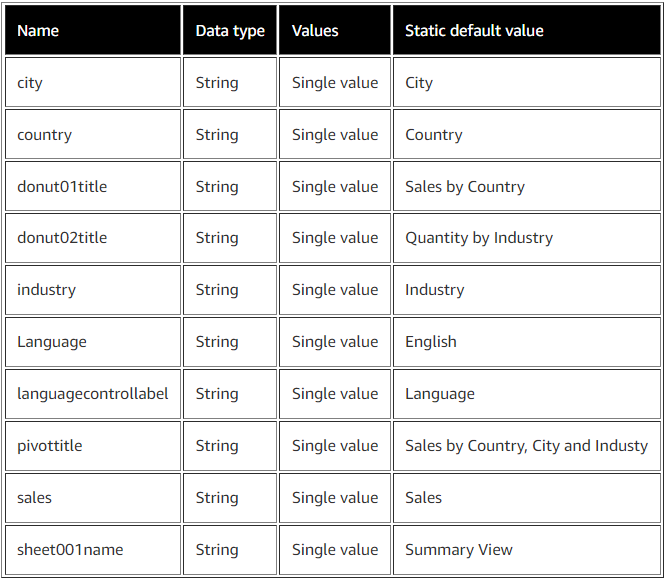\n\nThe parameters are now available on the **Parameters** menu.\n\n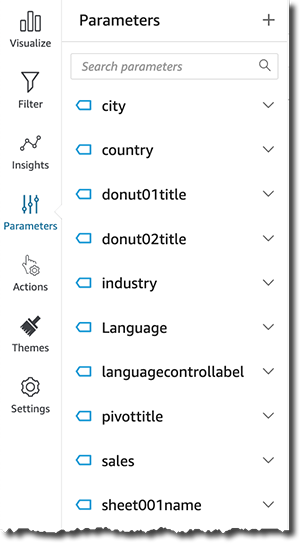\n\nYou can now use the parameters inside each sheet title, visual title, legend title, column header, axis label, and more in your analysis. The following screenshots provide examples that illustrate how to insert these parameters into each title.\n\nFirst, we insert the sheet name.\n\n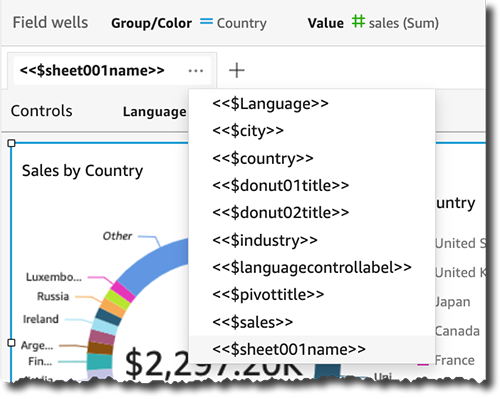\n\nThen we add the language control name.\n\n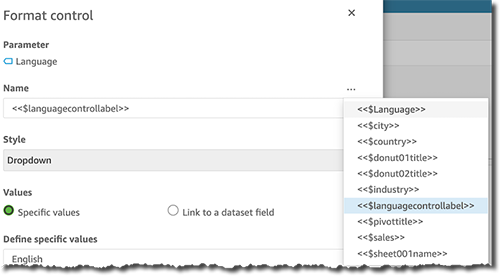\n\nWe edit the donut charts’ titles.\n\n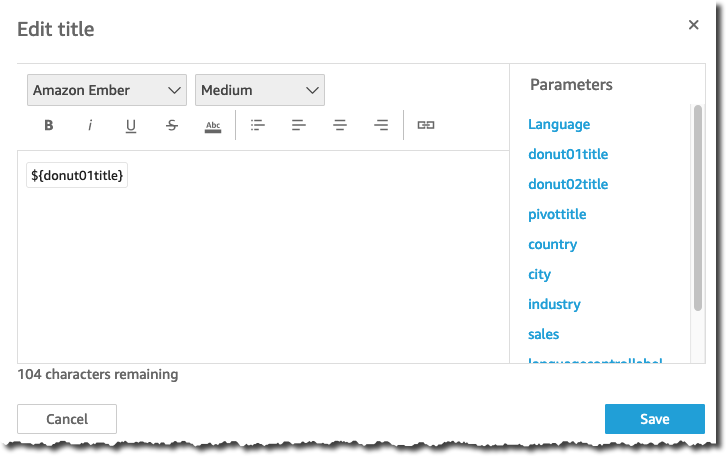\n\nWe also add the donut charts’ legend titles.\n\n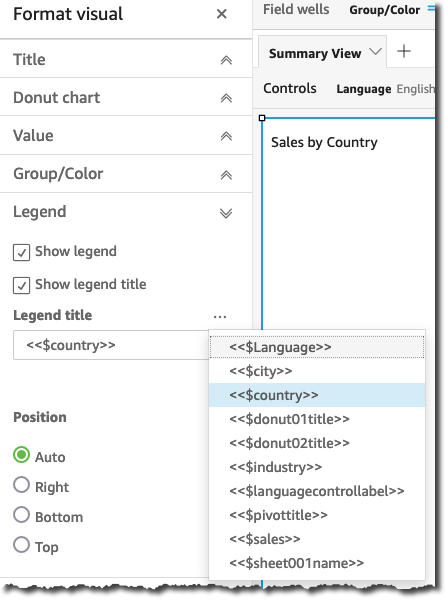\n\nIn the following screenshot, we specify the pivot table row names.\n\n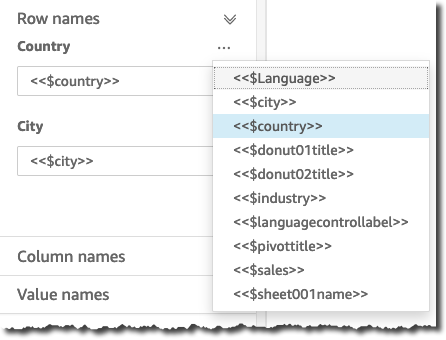\n\nWe also specify the pivot table column names.\n\n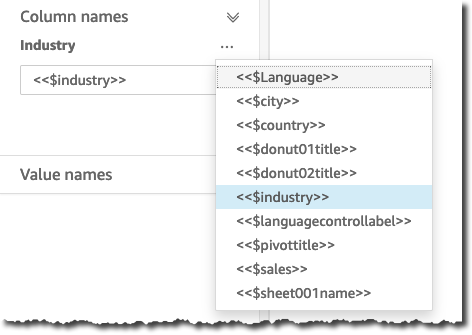\n\nPublish the analysis to a new dashboard and follow the steps in the post [Embed interactive dashboards in your apps and portals in minutes with Amazon QuickSight’s new 1-click embedding feature](https://aws.amazon.com/blogs/big-data/embed-interactive-dashboards-in-your-apps-and-portals-in-minutes-with-amazon-quicksights-new-1-click-embedding-feature/) to embed the dashboard in an HTML page hosted in your website or web application.\n\nThe example HTML page provided in the appendix of this post contains one control to switch among the four languages you created in the dataset in the previous sections with the option to automatically sync the QuickSight UI locale when changing the language, and one control to independently change the UI locale as required.\n\nThe following screenshots provide some examples of combinations of data language and QuickSight UI locale.\n\nThe following is an example of English data language with the English QuickSight UI locale.\n\n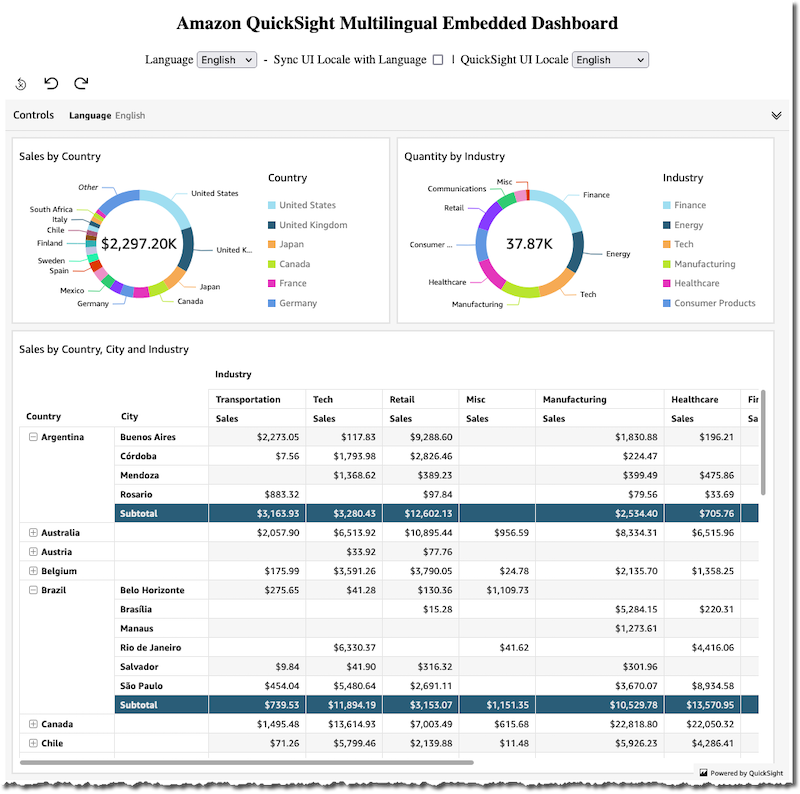\n\nThe following is an example of Italian data language with the synchronized Italian QuickSight UI locale.\n\n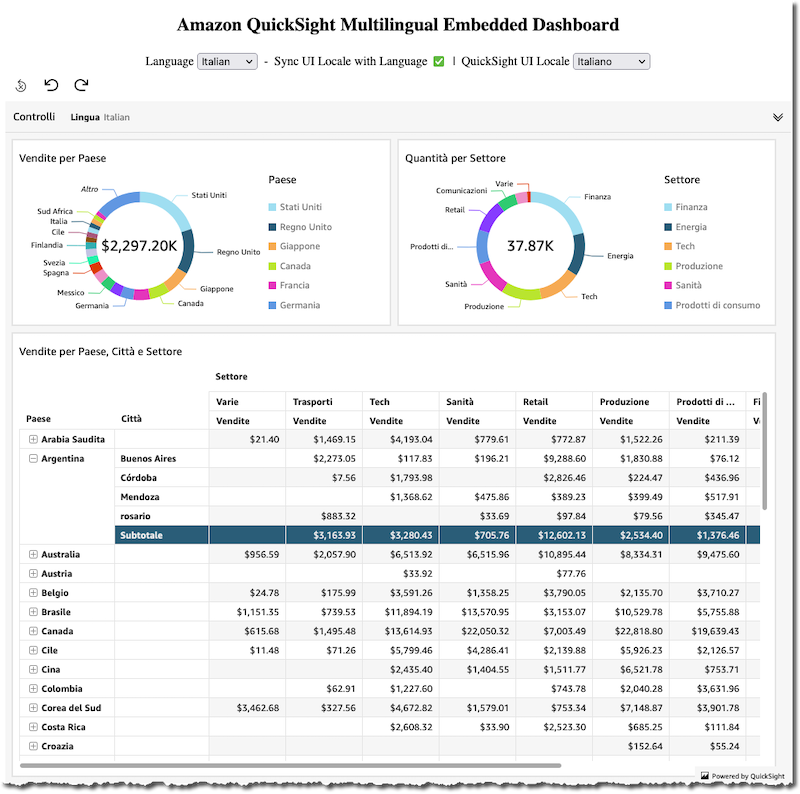\n\nThe following screenshot shows German data language with the Japanese QuickSight UI locale.\n\n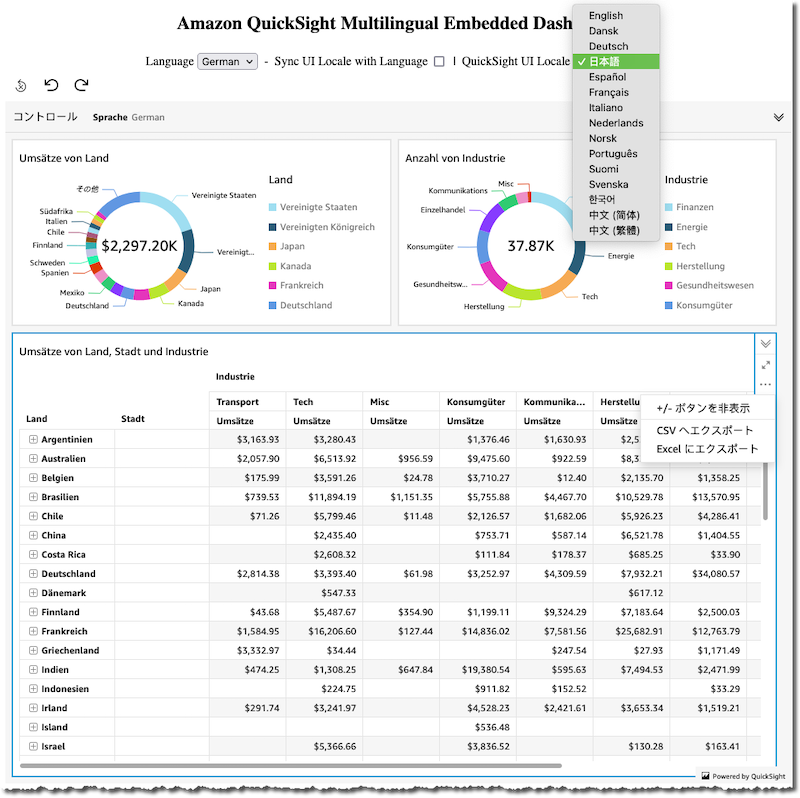\n\n#### **Conclusion**\nThis post demonstrated how to automatically translate data using machine learning and build a multilingual dashboard with Athena, QuickSight, and [Amazon Translate](https://aws.amazon.com/cn/translate/?trk=cndc-detail), and how to add advanced multilingual features with QuickSight embedded dashboards. You can use the same approach to display different values for dimensions as well as metrics depending on the values of one or more parameters.\n\nQuickSight provides a 30-day free trial subscription for four users; you can [get started](https://docs.aws.amazon.com/quicksight/latest/user/getting-started.html) immediately. You can learn more and ask questions about QuickSight in the [Amazon QuickSight Community](https://community.amazonquicksight.com/).\n\n#### **Appendix: Embedded dashboard host page**\nThe full code for the HTML page is as follows:\n\nHTML\n```\\n<!DOCTYPE html>\\n<html>\\n <head>\\n <title>Amazon QuickSight Multilingual Embedded Dashboard</title>\\n <script src=\\"https://unpkg.com/amazon-quicksight-embedding-sdk@1.18.1/dist/quicksight-embedding-js-sdk.min.js\\"></script>\\n <script type=\\"text/javascript\\">\\n\\n var url = \\"https://<<YOUR_AMAZON_QUICKSIGHT_REGION>>.quicksight.aws.amazon.com/sn/embed/share/accounts/<<YOUR_AWS_ACCOUNT_ID>>/dashboards/<<DASHBOARD_ID>>?directory_alias=<<YOUR_AMAZON_QUICKSIGHT_ACCOUNT_NAME>>\\"\\n var defaultLanguageOptions = 'en_US'\\n var dashboard\\n\\n var trns = {\\n en_US: {\\n locale: \\"en-US\\",\\n language: \\"English\\",\\n languagecontrollabel: \\"Language\\",\\n sheet001name: \\"Summary View\\",\\n sales: \\"Sales\\",\\n country: \\"Country\\",\\n city: \\"City\\",\\n industry: \\"Industry\\",\\n quantity: \\"Quantity\\",\\n by: \\"by\\",\\n and: \\"and\\"\\n },\\n de_DE: {\\n locale: \\"de-DE\\",\\n language: \\"German\\",\\n languagecontrollabel: \\"Sprache\\",\\n sheet001name: \\"Zusammenfassende Ansicht\\",\\n sales: \\"Umsätze\\",\\n country: \\"Land\\",\\n city: \\"Stadt\\",\\n industry: \\"Industrie\\",\\n quantity: \\"Anzahl\\",\\n by: \\"von\\",\\n and: \\"und\\"\\n },\\n it_IT: {\\n locale: \\"it-IT\\",\\n language: \\"Italian\\",\\n languagecontrollabel: \\"Lingua\\",\\n sheet001name: \\"Prospetto Riassuntivo\\",\\n sales: \\"Vendite\\",\\n country: \\"Paese\\",\\n city: \\"Città\\",\\n industry: \\"Settore\\",\\n quantity: \\"Quantità\\",\\n by: \\"per\\",\\n and: \\"e\\"\\n },\\n es_ES: {\\n locale: \\"es-ES\\",\\n language: \\"Spanish\\",\\n languagecontrollabel: \\"Idioma\\",\\n sheet001name: \\"Vista de Resumen\\",\\n sales: \\"Ventas\\",\\n country: \\"Paìs\\",\\n city: \\"Ciudad\\",\\n industry: \\"Industria\\",\\n quantity: \\"Cantidad\\",\\n by: \\"por\\",\\n and: \\"y\\"\\n }\\n }\\n\\n function setLanguageParameters(l){\\n\\n return {\\n Language: trns[l]['language'],\\n languagecontrollabel: trns[l]['languagecontrollabel'],\\n sheet001name: trns[l]['sheet001name'],\\n donut01title: trns[l]['sales']+\\" \\"+trns[l]['by']+\\" \\"+trns[l]['country'],\\n donut02title: trns[l]['quantity']+\\" \\"+trns[l]['by']+\\" \\"+trns[l]['industry'],\\n pivottitle: trns[l]['sales']+\\" \\"+trns[l]['by']+\\" \\"+trns[l]['country']+\\", \\"+trns[l]['city']+\\" \\"+trns[l]['and']+\\" \\"+trns[l]['industry'],\\n sales: trns[l]['sales'],\\n country: trns[l]['country'],\\n city: trns[l]['city'],\\n industry: trns[l]['industry'],\\n }\\n }\\n\\n function embedDashboard(lOpts, forceLocale) {\\n\\n var languageOptions = defaultLanguageOptions\\n if (lOpts) languageOptions = lOpts\\n\\n var containerDiv = document.getElementById(\\"embeddingContainer\\");\\n containerDiv.innerHTML = ''\\n\\n parameters = setLanguageParameters(languageOptions)\\n\\n if(!forceLocale) locale = trns[languageOptions]['locale']\\n else locale = forceLocale\\n\\n var options = {\\n url: url,\\n container: containerDiv,\\n parameters: parameters,\\n scrolling: \\"no\\",\\n height: \\"AutoFit\\",\\n loadingHeight: \\"930px\\",\\n width: \\"1024px\\",\\n locale: locale\\n };\\n\\n dashboard = QuickSightEmbedding.embedDashboard(options);\\n }\\n\\n function onLangChange(langSel) {\\n\\n var l = langSel.value\\n\\n if(!document.getElementById(\\"changeLocale\\").checked){\\n dashboard.setParameters(setLanguageParameters(l))\\n }\\n else {\\n var selLocale = document.getElementById(\\"locale\\")\\n selLocale.value = trns[l]['locale']\\n embedDashboard(l)\\n }\\n }\\n\\n function onLocaleChange(obj) {\\n\\n var locl = obj.value\\n var lang = document.getElementById(\\"lang\\").value\\n\\n document.getElementById(\\"changeLocale\\").checked = false\\n embedDashboard(lang,locl)\\n\\n }\\n\\n function onSyncLocaleChange(obj){\\n\\n if(obj.checked){\\n var selLocale = document.getElementById('locale')\\n var selLang = document.getElementById('lang').value\\n selLocale.value = trns[selLang]['locale']\\n embedDashboard(selLang, trns[selLang]['locale'])\\n } \\n }\\n\\n </script>\\n </head>\\n\\n <body onload=\\"embedDashboard()\\">\\n\\n <div style=\\"text-align: center; width: 1024px;\\">\\n <h2>Amazon QuickSight Multilingual Embedded Dashboard</h2>\\n\\n <span>\\n <label for=\\"lang\\">Language</label>\\n <select id=\\"lang\\" name=\\"lang\\" onchange=\\"onLangChange(this)\\">\\n <option value=\\"en_US\\" selected>English</option>\\n <option value=\\"de_DE\\">German</option>\\n <option value=\\"it_IT\\">Italian</option>\\n <option value=\\"es_ES\\">Spanish</option>\\n </select>\\n </span>\\n\\n - \\n \\n <span>\\n <label for=\\"changeLocale\\">Sync UI Locale with Language</label>\\n <input type=\\"checkbox\\" id=\\"changeLocale\\" name=\\"changeLocale\\" onchange=\\"onSyncLocaleChange(this)\\">\\n </span>\\n\\n | \\n\\n <span>\\n <label for=\\"locale\\">QuickSight UI Locale</label>\\n <select id=\\"locale\\" name=\\"locale\\" onchange=\\"onLocaleChange(this)\\">\\n <option value=\\"en-US\\" selected>English</option>\\n <option value=\\"da-DK\\">Dansk</option>\\n <option value=\\"de-DE\\">Deutsch</option>\\n <option value=\\"ja-JP\\">日本語</option>\\n <option value=\\"es-ES\\">Español</option>\\n <option value=\\"fr-FR\\">Français</option>\\n <option value=\\"it-IT\\">Italiano</option>\\n <option value=\\"nl-NL\\">Nederlands</option>\\n <option value=\\"nb-NO\\">Norsk</option>\\n <option value=\\"pt-BR\\">Português</option>\\n <option value=\\"fi-FI\\">Suomi</option>\\n <option value=\\"sv-SE\\">Svenska</option>\\n <option value=\\"ko-KR\\">한국어</option>\\n <option value=\\"zh-CN\\">中文 (简体)</option>\\n <option value=\\"zh-TW\\">中文 (繁體)</option> \\n </select>\\n </span>\\n </div>\\n\\n <div id=\\"embeddingContainer\\"></div>\\n\\n </body>\\n\\n</html>\\n```\n\n##### **About the Author**\n\n\n\n**Francesco Marelli** is a principal solutions architect at Amazon Web Services. He is specialized in the design and implementation of analytics, data management, and big data systems. Francesco also has a strong experience in systems integration and design and implementation of applications. He is passionate about music, collecting vinyl records, and playing bass.","render":"<p><a href=\\"https://aws.amazon.com/quicksight/\\" target=\\"_blank\\">Amazon QuickSight</a> is a serverless business intelligence (BI) service used by organizations of any size to make better data-driven decisions. QuickSight dashboards can also be embedded into SaaS apps and web portals to provide interactive dashboards, natural language query or data analysis capabilities to app users seamlessly. The <a href=\\"https://democentral.learnquicksight.online/#\\" target=\\"_blank\\">QuickSight Demo Central</a> contains many dashboards, feature showcase and tips and tricks that you can use; in the <a href=\\"https://developer.quicksight.aws/embedSample/dashboard#/embed-url-in-your-application\\" target=\\"_blank\\">QuickSight Embedded Analytics Developer Portal</a> you can find details on how to embed dashboards in your applications.</p>\\n<p>The QuickSight user interface currently supports 15 languages that <a href=\\"https://docs.aws.amazon.com/quicksight/latest/user/choosing-a-language-in-quicksight.html\\" target=\\"_blank\\">you can choose</a> on a per-user basis. The language selected for the user interface localizes all text generated by QuickSight with respect to UI components and isn’t applied to the data displayed in the dashboards.</p>\\n<p>This post describes how to create multilingual dashboards at the data level by creating new columns that contain the translated text and providing a language selection parameter and associated control to display data in the selected language in a QuickSight dashboard. You can create new columns with the translated text in several ways; in this post we create new columns using <a href=\\"https://aws.amazon.com/athena/\\" target=\\"_blank\\"><br />\\nAmazon Athena</a> user-defined functions implemented in the GitHub project sample <a href=\\"https://github.com/aws-samples/aws-athena-udfs-textanalytics\\" target=\\"_blank\\">Amazon Athena UDFs for text translation and analytics using Amazon Comprehend and Amazon Translate</a>. This approach makes it easy to automatically create columns with translated text using neural machine translation provided by <a href=\\"https://aws.amazon.com/translate/\\" target=\\"_blank\\">Amazon Translate</a>.</p>\\n<h4><a id=\\"Solution_overview_7\\"></a><strong>Solution overview</strong></h4>\\n<p>The following diagram illustrates the architecture of this solution.</p>\n<p><img src=\\"https://dev-media.amazoncloud.cn/3a1c6873e67b425b963ab2982993bc60_image.png\\" alt=\\"image.png\\" /></p>\n<p>For this post, we use the sample <a href=\\"https://ee-assets-prod-us-east-1.s3.amazonaws.com/modules/337d5d05acc64a6fa37bcba6b921071c/v1/SaaS-Sales.csv\\" target=\\"_blank\\">SaaS-Sales.csv</a> dataset and follow these steps:</p>\\n<ol>\\n<li><a href=\\"https://docs.aws.amazon.com/AmazonS3/latest/userguide/upload-objects.html\\" target=\\"_blank\\">Copy</a> the dataset to a bucket in <a href=\\"https://aws.amazon.com/s3/\\" target=\\"_blank\\">Amazon Simple Storage Service</a> ([Amazon S3](https://aws.amazon.com/cn/s3/?trk=cndc-detail)).</li>\\n<li>Use Athena to define a database and table to read the CSV file.</li>\n<li>Create a new table in Parquet format with the columns with the translated text.</li>\n<li>Create a new dataset in QuickSight.</li>\n<li>Create the parameter and control to select the language.</li>\n<li>Create dynamic multilingual calculated fields.</li>\n<li>Create an analysis with calculated multilingual calculated fields.</li>\n<li>Publish the multilingual dashboard.</li>\n<li>Create parametric headers and titles for visuals for use in an embedded dashboard.</li>\n</ol>\\n<p>An alternative approach might be to directly <a href=\\"https://docs.aws.amazon.com/quicksight/latest/user/choosing-file-upload-settings.html\\" target=\\"_blank\\">upload the CSV</a> dataset to QuickSight and create the new columns with translated text as QuickSight <a href=\\"https://docs.aws.amazon.com/quicksight/latest/user/working-with-calculated-fields.html\\" target=\\"_blank\\">calculated fields</a>, for example using the <a href=\\"https://docs.aws.amazon.com/quicksight/latest/user/ifelse-function.html\\" target=\\"_blank\\">ifelse() conditional function</a> to directly assign the translated values.</p>\\n<h4><a id=\\"Prerequisites_26\\"></a><strong>Prerequisites</strong></h4>\\n<p>To follow the steps in this post, you need to have an AWS account with an active QuickSight Standard Edition or Enterprise Edition <a href=\\"https://docs.aws.amazon.com/quicksight/latest/user/signing-up.html\\" target=\\"_blank\\">subscription</a>.</p>\\n<h4><a id=\\"Copy_the_dataset_to_a_bucket_in_Amazon_S3_29\\"></a><strong>Copy the dataset to a bucket in Amazon S3</strong></h4>\\n<p>Use the <a href=\\"https://aws.amazon.com/cli/\\" target=\\"_blank\\">AWS Command Line Interface (AWS CLI)</a> to create the S3 bucket <code>qs-ml-blog-data</code> and copy the dataset under the prefix <code>saas-sales</code> in your AWS account. You must follow the <a href=\\"https://docs.aws.amazon.com/AmazonS3/latest/userguide/bucketnamingrules.html\\" target=\\"_blank\\">bucket naming rules</a> to create your bucket. See the following code:</p>\\n<p>Bash</p>\n<pre><code class=\\"lang-\\">\$ MY_BUCKET=qs-ml-blog-data\\n\$ PREFIX=saas-sales\\n\\n\$ aws s3 mb s3://\${MY_BUCKET}/\\n\\n\$ aws s3 cp \\\\\\n "s3://ee-assets-prod-us-east-1/modules/337d5d05acc64a6fa37bcba6b921071c/v1/SaaS-Sales.csv" \\\\\\n "s3://\${MY_BUCKET}/\${PREFIX}/SaaS-Sales.csv"\\n</code></pre>\\n<h4><a id=\\"Define_a_database_and_table_to_read_the_CSV_file_43\\"></a><strong>Define a database and table to read the CSV file</strong></h4>\\n<p>Use the Athena query editor to create the database <code>qs_ml_blog_db</code>:</p>\\n<p>SQL</p>\n<pre><code class=\\"lang-\\">CREATE DATABASE IF NOT EXISTS qs_ml_blog_db;\\n</code></pre>\\n<p>Then create the new table <code>qs_ml_blog_db.saas_sales</code>:</p>\\n<p>SQL</p>\n<pre><code class=\\"lang-\\">CREATE EXTERNAL TABLE IF NOT EXISTS qs_ml_blog_db.saas_sales (\\n row_id bigint, \\n order_id string, \\n order_date string, \\n date_key bigint, \\n contact_name string, \\n country_en string, \\n city_en string, \\n region string, \\n subregion string, \\n customer string, \\n customer_id bigint, \\n industry_en string, \\n segment string, \\n product string, \\n license string, \\n sales double, \\n quantity bigint, \\n discount double, \\n profit double)\\nROW FORMAT DELIMITED \\n FIELDS TERMINATED BY ',' \\nSTORED AS INPUTFORMAT \\n 'org.apache.hadoop.mapred.TextInputFormat' \\nOUTPUTFORMAT \\n 'org.apache.hadoop.hive.ql.io.HiveIgnoreKeyTextOutputFormat'\\nLOCATION\\n 's3://<MY_BUCKET>/saas-sales/'\\nTBLPROPERTIES (\\n 'areColumnsQuoted'='false', \\n 'classification'='csv', \\n 'columnsOrdered'='true', \\n 'compressionType'='none', \\n 'delimiter'=',', \\n 'skip.header.line.count'='1', \\n 'typeOfData'='file')\\n</code></pre>\\n<h4><a id=\\"Create_a_new_table_in_Parquet_format_with_the_columns_with_the_translated_text_91\\"></a><strong>Create a new table in Parquet format with the columns with the translated text</strong></h4>\\n<p>We want to translate the columns <code>country_en</code>, <code>city_en</code>, and <code>industry_en</code> to German, Spanish, and Italian. To do this in a scalable and flexible way, we use the GitHub project sample <a href=\\"https://github.com/aws-samples/aws-athena-udfs-textanalytics\\" target=\\"_blank\\">Amazon Athena UDFs for text translation and analytics using Amazon Comprehend and Amazon Translate</a>.</p>\\n<p>After you set up the user-defined functions following the instructions in the <a href=\\"https://github.com/aws-samples/aws-athena-udfs-textanalytics/blob/main/athena-udfs-textanalytics/README.md\\" target=\\"_blank\\">GitHub repo</a>, run the following SQL query in Athena to create the new table <code>qs_ml_blog_db.saas_sales_ml</code> with the translated columns using the <code>translate_text</code> user-defined function and some other minor changes:</p>\\n<p>SQL</p>\n<pre><code class=\\"lang-\\">CREATE TABLE qs_ml_blog_db.saas_sales_ml WITH (\\n format = 'PARQUET',\\n parquet_compression = 'SNAPPY',\\n external_location = 's3://<MY_BUCKET>/saas-sales-ml/'\\n) AS \\nUSING EXTERNAL FUNCTION translate_text(text_col VARCHAR, sourcelang VARCHAR, targetlang VARCHAR, terminologyname VARCHAR) RETURNS VARCHAR LAMBDA 'textanalytics-udf'\\nSELECT \\nrow_id,\\norder_id,\\ndate_parse("order_date",'%m/%d/%Y') as order_date,\\ndate_key,\\ncontact_name,\\ncountry_en,\\ntranslate_text(country_en, 'en', 'de', NULL) as country_de,\\ntranslate_text(country_en, 'en', 'es', NULL) as country_es,\\ntranslate_text(country_en, 'en', 'it', NULL) as country_it,\\ncity_en,\\ntranslate_text(city_en, 'en', 'de', NULL) as city_de,\\ntranslate_text(city_en, 'en', 'es', NULL) as city_es,\\ntranslate_text(city_en, 'en', 'it', NULL) as city_it,\\nregion,\\nsubregion,\\ncustomer,\\ncustomer_id,\\nindustry_en,\\ntranslate_text(industry_en, 'en', 'de', NULL) as industry_de,\\ntranslate_text(industry_en, 'en', 'es', NULL) as industry_es,\\ntranslate_text(industry_en, 'en', 'it', NULL) as industry_it,\\nsegment,\\nproduct,\\nlicense,\\nsales,\\nquantity,\\ndiscount,\\nprofit\\nFROM qs_ml_blog_db.saas_sales\\n;\\n</code></pre>\\n<p>Run three simple queries, one per column, to check the generation of the new columns with the translation was successful. We include a screenshot after each query showing its results.</p>\n<p>SQL</p>\n<pre><code class=\\"lang-\\">SELECT \\ndistinct(country_en),\\ncountry_de,\\ncountry_es,\\ncountry_it\\nFROM qs_ml_blog_db.saas_sales_ml \\nORDER BY country_en\\nlimit 10\\n;\\nSQL\\n</code></pre>\\n<p><img src=\\"https://dev-media.amazoncloud.cn/422577e0727d420cbc77bfebb8fe1708_image.png\\" alt=\\"image.png\\" /></p>\n<p>SQL</p>\n<pre><code class=\\"lang-\\">SELECT \\ndistinct(city_en),\\ncity_de,\\ncity_es,\\ncity_it\\nFROM qs_ml_blog_db.saas_sales_ml \\nORDER BY city_en\\nlimit 10\\n;\\n</code></pre>\\n<p><img src=\\"https://dev-media.amazoncloud.cn/b68def1e723b4a1cb0694362905e554b_image.png\\" alt=\\"image.png\\" /></p>\n<p>SQL</p>\n<pre><code class=\\"lang-\\">SELECT \\ndistinct(industry_en),\\nindustry_de,\\nindustry_es,\\nindustry_it\\nFROM qs_ml_blog_db.saas_sales_ml \\nORDER BY industry_en\\nlimit 10\\n;\\n</code></pre>\\n<p><img src=\\"https://dev-media.amazoncloud.cn/c74a3a1f603843fdbaca414477e8408e_image.png\\" alt=\\"image.png\\" /></p>\n<p>Now you can use the new table <code>saas_sales_ml</code> as input to create a dataset in QuickSight.</p>\\n<h4><a id=\\"Create_a_dataset_in_QuickSight_185\\"></a><strong>Create a dataset in QuickSight</strong></h4>\\n<p>To create your dataset in QuickSight, complete the following steps:</p>\n<ol>\\n<li>On the QuickSight console, choose <strong>Datasets</strong> in the navigation pane.</li>\\n<li>Choose <strong>Create a dataset</strong>.</li>\\n<li>Choose <strong>Athena</strong>.</li>\\n<li>For <strong>Data source name</strong>¸ enter <code>athena_primary</code>.</li>\\n<li>For <strong>Athena workgroup</strong>¸ choose <strong>primary</strong>.</li>\\n<li>Choose <strong>Create data source</strong>.</li>\\n</ol>\n<p><img src=\\"https://dev-media.amazoncloud.cn/b55fe6ca2eab4e9e81795fc989e8ae2b_image.png\\" alt=\\"image.png\\" /></p>\n<p>7.Select the <code>saas_sales_ml</code> table previously created and choose <strong>Select</strong>.</p>\\n<p><img src=\\"https://dev-media.amazoncloud.cn/0c51978b637946f5bc1cb194a7031dfb_image.png\\" alt=\\"image.png\\" /></p>\n<p>8.Choose to import the table to SPICE and choose Visualize to start creating the new dashboard.</p>\n<p><img src=\\"https://dev-media.amazoncloud.cn/a1481d77b81e4d4083b4fe4b9e268821_image.png\\" alt=\\"image.png\\" /></p>\n<p>In the analysis section, you receive a message that informs you that the table was successfully imported to SPICE.</p>\n<p><img src=\\"https://dev-media.amazoncloud.cn/91f99baea22e46af8ee139adb77111c9_image.png\\" alt=\\"image.png\\" /></p>\n<h4><a id=\\"Create_the_parameter_and_control_to_select_the_language_209\\"></a><strong>Create the parameter and control to select the language</strong></h4>\\n<p>To create the parameter and associate the control that you use to select the language for the dashboard, complete the following steps:</p>\n<ol>\\n<li>In the analysis section, choose <strong>Parameters</strong> and <strong>Create one</strong>.</li>\\n<li>For <strong>Name</strong>, enter <code>Language</code>.</li>\\n<li>For <strong>Data type</strong>, choose <strong>String</strong>.</li>\\n<li>For <strong>Values</strong>, select <strong>Single value</strong>.</li>\\n<li>For <strong>Static default value</strong>, enter <code>English</code>.</li>\\n<li>Choose <strong>Create</strong>.</li>\\n</ol>\n<p><img src=\\"https://dev-media.amazoncloud.cn/45ef68be59934c6fa49bb268908b3494_image.png\\" alt=\\"image.png\\" /></p>\n<p>7.To connect the parameter to a control, choose <strong>Control</strong>.</p>\\n<p><img src=\\"https://dev-media.amazoncloud.cn/589a7fe6d64544e98e83c21549eaa6d7_image.png\\" alt=\\"image.png\\" /></p>\n<p>8.For <strong>Display name</strong>, choose <strong>Language</strong>.<br />\\n9.For <strong>Style</strong>, choose <strong>Dropdown</strong>.<br />\\n10.For <strong>Values</strong>, select <strong>Specific values</strong>.<br />\\n11.For <strong>Define specific values</strong>, enter <code>English</code>, <code>German</code>, <code>Italian</code>, and <code>French</code> (one value per line).<br />\\n12.Select <strong>Hide Select all option from the control values if the parameter has a default configured</strong>.<br />\\n13.Choose <strong>Add</strong>.</p>\\n<p><img src=\\"https://dev-media.amazoncloud.cn/5c5978b1863f42c4854ad0de04ebe58b_image.png\\" alt=\\"image.png\\" /></p>\n<p>The control is now available, linked to the parameter and displayed in the <strong>Controls</strong> section of the current sheet in the analysis.</p>\\n<p><img src=\\"https://dev-media.amazoncloud.cn/ad1ad2bf4c8a435aacf1d91d26957a9c_image.png\\" alt=\\"image.png\\" /></p>\n<h4><a id=\\"Create_dynamic_multilingual_calculated_fields_238\\"></a><strong>Create dynamic multilingual calculated fields</strong></h4>\\n<p>You’re now ready to create the calculated fields whose value will change based on the currently selected language.</p>\n<ol>\\n<li>In the menu bar, choose <strong>Add</strong> and choose <strong>Add calculated field</strong>.</li>\\n</ol>\n<p><img src=\\"https://dev-media.amazoncloud.cn/16f46a7601f54e5fafaba7f9423ca5de_image.png\\" alt=\\"image.png\\" /></p>\n<ol start=\\"2\\">\\n<li>Use the <a href=\\"https://docs.aws.amazon.com/quicksight/latest/user/ifelse-function.html\\" target=\\"_blank\\">ifelse conditional function</a> to evaluate the value of the <code>Language</code> parameter and select the correct column in the dataset to assign the value to the calculated field.</li>\\n<li>Create the <code>Country</code> calculated field using the following expression:</li>\\n</ol>\n<pre><code class=\\"lang-\\">ifelse(\\n \${Language} = 'English', {country_en},\\n \${Language} = 'German', {country_de},\\n \${Language} = 'Italian', {country_it},\\n \${Language} = 'Spanish', {country_es},\\n {country_en}\\n)\\n</code></pre>\\n<ol start=\\"4\\">\\n<li>Choose <strong>Save</strong>.</li>\\n</ol>\n<p><img src=\\"https://dev-media.amazoncloud.cn/11d9c485481849f0b0b3cc4c4818b987_image.png\\" alt=\\"image.png\\" /></p>\n<ol start=\\"5\\">\\n<li>Repeat the process for the <code>City</code> calculated field:</li>\\n</ol>\n<pre><code class=\\"lang-\\">ifelse(\\n \${Language} = 'English', {city_en},\\n \${Language} = 'German', {city_de},\\n \${Language} = 'Italian', {city_it},\\n \${Language} = 'Spanish', {city_es},\\n {city_en}\\n)\\n</code></pre>\\n<ol start=\\"6\\">\\n<li>Repeat the process for the <code>Industry</code> calculated field:</li>\\n</ol>\n<pre><code class=\\"lang-\\">ifelse(\\n \${Language} = 'English', {industry_en},\\n \${Language} = 'German', {industry_de},\\n \${Language} = 'Italian', {industry_it},\\n \${Language} = 'Spanish', {industry_es},\\n {industry_en}\\n)\\n</code></pre>\\n<p>The calculated fields are now available and ready to use in the analysis.</p>\n<p><img src=\\"https://dev-media.amazoncloud.cn/2ef5953c656e4e25b347c01929ff1081_image.png\\" alt=\\"image.png\\" /></p>\n<h4><a id=\\"Create_an_analysis_with_calculated_multilingual_calculated_fields_284\\"></a><strong>Create an analysis with calculated multilingual calculated fields</strong></h4>\\n<p>Create an analysis with two <a href=\\"https://docs.aws.amazon.com/quicksight/latest/user/donut-chart.html\\" target=\\"_blank\\">donut charts</a> and a <a href=\\"https://docs.aws.amazon.com/quicksight/latest/user/pivot-table.html\\" target=\\"_blank\\">pivot table</a> that use the three multilingual fields. In the subtitle of the visuals, use the string <code>Language: <<\$Language>></code> to display the currently selected language. The following screenshot shows our analysis.</p>\\n<p><img src=\\"https://dev-media.amazoncloud.cn/a5105a8a4c1146159b77b6254295c3b7_image.png\\" alt=\\"image.png\\" /></p>\n<p>If you choose a new language from the <strong>Language</strong> control, the visuals adapt accordingly. The following screenshot shows the analysis in Italian.</p>\\n<p><img src=\\"https://dev-media.amazoncloud.cn/5ac844dfbd914c809d2298305255f993_image.png\\" alt=\\"image.png\\" /></p>\n<p>You’re now ready to publish the analysis as a dashboard.</p>\n<h4><a id=\\"Publish_the_multilingual_dashboard_295\\"></a><strong>Publish the multilingual dashboard</strong></h4>\\n<p>In the menu bar, choose <strong>Share</strong> and <strong>Publish dashboard</strong>.</p>\\n<p><img src=\\"https://dev-media.amazoncloud.cn/6c782bc1169940ac94519e6ddc5b7d5e_image.png\\" alt=\\"image.png\\" /></p>\n<p>Publish the new dashboard as “Multilingual dashboard,” leave the advanced publish options at their default values, and <strong>choose Publish dashboard</strong>.</p>\\n<p><img src=\\"https://dev-media.amazoncloud.cn/2d7e9d76bfa34e8aad54ca98d8da1d2b_image.png\\" alt=\\"image.png\\" /></p>\n<p>The dashboard is now ready.</p>\n<p><img src=\\"https://dev-media.amazoncloud.cn/d8ab7defdcb442608839bda32673e9d3_image.png\\" alt=\\"image.png\\" /></p>\n<p>We can take the multilingual features one step further by embedding the dashboard and controlling the parameters in the external page using the <a href=\\"https://github.com/awslabs/amazon-quicksight-embedding-sdk\\" target=\\"_blank\\">Amazon QuickSight Embedding SDK</a>.</p>\\n<h4><a id=\\"Create_parametric_headers_and_titles_for_visuals_for_use_in_an_embedded_dashboard_310\\"></a><strong>Create parametric headers and titles for visuals for use in an embedded dashboard</strong></h4>\\n<p>When <a href=\\"https://docs.aws.amazon.com/quicksight/latest/user/embedded-analytics.html\\" target=\\"_blank\\">embedding an QuickSight dashboard</a>, the <a href=\\"https://github.com/awslabs/amazon-quicksight-embedding-sdk#locale-element-optional\\" target=\\"_blank\\">locale</a> and parameters’ values can be <a href=\\"https://github.com/awslabs/amazon-quicksight-embedding-sdk#step-6-update-parameter-values-optional\\" target=\\"_blank\\">set programmatically from JavaScript</a>. This can be useful to set default values and change the settings for localization and the default data language. The following steps show how to use these features by modifying the dashboard we have created so far, embedding it in an HTML page, and using the <a href=\\"https://github.com/awslabs/amazon-quicksight-embedding-sdk\\" target=\\"_blank\\">Amazon QuickSight Embedding SDK</a> to dynamically set the value of parameters used to display titles, legends, headers, and more in translated text. The full code for the HTML page is also provided in the appendix of this post.</p>\\n<p>Create new parameters for the titles and the headers of the visuals in the analysis, the sheet name, visuals legends, and control labels as per the following table.</p>\n<p><img src=\\"https://dev-media.amazoncloud.cn/1e1a913f06734ca2b6878fc601ef4a34_image.png\\" alt=\\"image.png\\" /></p>\n<p>The parameters are now available on the <strong>Parameters</strong> menu.</p>\\n<p><img src=\\"https://dev-media.amazoncloud.cn/a42959db336c41388454c0dd83f0c041_image.png\\" alt=\\"image.png\\" /></p>\n<p>You can now use the parameters inside each sheet title, visual title, legend title, column header, axis label, and more in your analysis. The following screenshots provide examples that illustrate how to insert these parameters into each title.</p>\n<p>First, we insert the sheet name.</p>\n<p><img src=\\"https://dev-media.amazoncloud.cn/90217c725b3f4d2e8a888ee9a2a5aa02_image.png\\" alt=\\"image.png\\" /></p>\n<p>Then we add the language control name.</p>\n<p><img src=\\"https://dev-media.amazoncloud.cn/21dc6500a9af492c87f4a5655dbdeb19_image.png\\" alt=\\"image.png\\" /></p>\n<p>We edit the donut charts’ titles.</p>\n<p><img src=\\"https://dev-media.amazoncloud.cn/0ae4673e29d3483fb60402d337cfe0c1_image.png\\" alt=\\"image.png\\" /></p>\n<p>We also add the donut charts’ legend titles.</p>\n<p><img src=\\"https://dev-media.amazoncloud.cn/414d7060d8fd4237aace13c11586b59e_image.png\\" alt=\\"image.png\\" /></p>\n<p>In the following screenshot, we specify the pivot table row names.</p>\n<p><img src=\\"https://dev-media.amazoncloud.cn/36d68182ca254c7d85bc0861627ac6d2_image.png\\" alt=\\"image.png\\" /></p>\n<p>We also specify the pivot table column names.</p>\n<p><img src=\\"https://dev-media.amazoncloud.cn/7c2cbe9e89714e7da4c705001341e79e_image.png\\" alt=\\"image.png\\" /></p>\n<p>Publish the analysis to a new dashboard and follow the steps in the post <a href=\\"https://aws.amazon.com/blogs/big-data/embed-interactive-dashboards-in-your-apps-and-portals-in-minutes-with-amazon-quicksights-new-1-click-embedding-feature/\\" target=\\"_blank\\">Embed interactive dashboards in your apps and portals in minutes with Amazon QuickSight’s new 1-click embedding feature</a> to embed the dashboard in an HTML page hosted in your website or web application.</p>\\n<p>The example HTML page provided in the appendix of this post contains one control to switch among the four languages you created in the dataset in the previous sections with the option to automatically sync the QuickSight UI locale when changing the language, and one control to independently change the UI locale as required.</p>\n<p>The following screenshots provide some examples of combinations of data language and QuickSight UI locale.</p>\n<p>The following is an example of English data language with the English QuickSight UI locale.</p>\n<p><img src=\\"https://dev-media.amazoncloud.cn/9e23c51554614057b966f4631198a426_image.png\\" alt=\\"image.png\\" /></p>\n<p>The following is an example of Italian data language with the synchronized Italian QuickSight UI locale.</p>\n<p><img src=\\"https://dev-media.amazoncloud.cn/a76266dba0f54af68f7fed8cdbe15152_image.png\\" alt=\\"image.png\\" /></p>\n<p>The following screenshot shows German data language with the Japanese QuickSight UI locale.</p>\n<p><img src=\\"https://dev-media.amazoncloud.cn/6e763005a05e41d49cdcde3e82fe8554_image.png\\" alt=\\"image.png\\" /></p>\n<h4><a id=\\"Conclusion_366\\"></a><strong>Conclusion</strong></h4>\\n<p>This post demonstrated how to automatically translate data using machine learning and build a multilingual dashboard with Athena, QuickSight, and Amazon Translate, and how to add advanced multilingual features with QuickSight embedded dashboards. You can use the same approach to display different values for dimensions as well as metrics depending on the values of one or more parameters.</p>\n<p>QuickSight provides a 30-day free trial subscription for four users; you can <a href=\\"https://docs.aws.amazon.com/quicksight/latest/user/getting-started.html\\" target=\\"_blank\\">get started</a> immediately. You can learn more and ask questions about QuickSight in the <a href=\\"https://community.amazonquicksight.com/\\" target=\\"_blank\\">Amazon QuickSight Community</a>.</p>\\n<h4><a id=\\"Appendix_Embedded_dashboard_host_page_371\\"></a><strong>Appendix: Embedded dashboard host page</strong></h4>\\n<p>The full code for the HTML page is as follows:</p>\n<p>HTML</p>\n<pre><code class=\\"lang-\\"><!DOCTYPE html>\\n<html>\\n <head>\\n <title>Amazon QuickSight Multilingual Embedded Dashboard</title>\\n <script src="https://unpkg.com/amazon-quicksight-embedding-sdk@1.18.1/dist/quicksight-embedding-js-sdk.min.js"></script>\\n <script type="text/javascript">\\n\\n var url = "https://<<YOUR_AMAZON_QUICKSIGHT_REGION>>.quicksight.aws.amazon.com/sn/embed/share/accounts/<<YOUR_AWS_ACCOUNT_ID>>/dashboards/<<DASHBOARD_ID>>?directory_alias=<<YOUR_AMAZON_QUICKSIGHT_ACCOUNT_NAME>>"\\n var defaultLanguageOptions = 'en_US'\\n var dashboard\\n\\n var trns = {\\n en_US: {\\n locale: "en-US",\\n language: "English",\\n languagecontrollabel: "Language",\\n sheet001name: "Summary View",\\n sales: "Sales",\\n country: "Country",\\n city: "City",\\n industry: "Industry",\\n quantity: "Quantity",\\n by: "by",\\n and: "and"\\n },\\n de_DE: {\\n locale: "de-DE",\\n language: "German",\\n languagecontrollabel: "Sprache",\\n sheet001name: "Zusammenfassende Ansicht",\\n sales: "Umsätze",\\n country: "Land",\\n city: "Stadt",\\n industry: "Industrie",\\n quantity: "Anzahl",\\n by: "von",\\n and: "und"\\n },\\n it_IT: {\\n locale: "it-IT",\\n language: "Italian",\\n languagecontrollabel: "Lingua",\\n sheet001name: "Prospetto Riassuntivo",\\n sales: "Vendite",\\n country: "Paese",\\n city: "Città",\\n industry: "Settore",\\n quantity: "Quantità",\\n by: "per",\\n and: "e"\\n },\\n es_ES: {\\n locale: "es-ES",\\n language: "Spanish",\\n languagecontrollabel: "Idioma",\\n sheet001name: "Vista de Resumen",\\n sales: "Ventas",\\n country: "Paìs",\\n city: "Ciudad",\\n industry: "Industria",\\n quantity: "Cantidad",\\n by: "por",\\n and: "y"\\n }\\n }\\n\\n function setLanguageParameters(l){\\n\\n return {\\n Language: trns[l]['language'],\\n languagecontrollabel: trns[l]['languagecontrollabel'],\\n sheet001name: trns[l]['sheet001name'],\\n donut01title: trns[l]['sales']+" "+trns[l]['by']+" "+trns[l]['country'],\\n donut02title: trns[l]['quantity']+" "+trns[l]['by']+" "+trns[l]['industry'],\\n pivottitle: trns[l]['sales']+" "+trns[l]['by']+" "+trns[l]['country']+", "+trns[l]['city']+" "+trns[l]['and']+" "+trns[l]['industry'],\\n sales: trns[l]['sales'],\\n country: trns[l]['country'],\\n city: trns[l]['city'],\\n industry: trns[l]['industry'],\\n }\\n }\\n\\n function embedDashboard(lOpts, forceLocale) {\\n\\n var languageOptions = defaultLanguageOptions\\n if (lOpts) languageOptions = lOpts\\n\\n var containerDiv = document.getElementById("embeddingContainer");\\n containerDiv.innerHTML = ''\\n\\n parameters = setLanguageParameters(languageOptions)\\n\\n if(!forceLocale) locale = trns[languageOptions]['locale']\\n else locale = forceLocale\\n\\n var options = {\\n url: url,\\n container: containerDiv,\\n parameters: parameters,\\n scrolling: "no",\\n height: "AutoFit",\\n loadingHeight: "930px",\\n width: "1024px",\\n locale: locale\\n };\\n\\n dashboard = QuickSightEmbedding.embedDashboard(options);\\n }\\n\\n function onLangChange(langSel) {\\n\\n var l = langSel.value\\n\\n if(!document.getElementById("changeLocale").checked){\\n dashboard.setParameters(setLanguageParameters(l))\\n }\\n else {\\n var selLocale = document.getElementById("locale")\\n selLocale.value = trns[l]['locale']\\n embedDashboard(l)\\n }\\n }\\n\\n function onLocaleChange(obj) {\\n\\n var locl = obj.value\\n var lang = document.getElementById("lang").value\\n\\n document.getElementById("changeLocale").checked = false\\n embedDashboard(lang,locl)\\n\\n }\\n\\n function onSyncLocaleChange(obj){\\n\\n if(obj.checked){\\n var selLocale = document.getElementById('locale')\\n var selLang = document.getElementById('lang').value\\n selLocale.value = trns[selLang]['locale']\\n embedDashboard(selLang, trns[selLang]['locale'])\\n } \\n }\\n\\n </script>\\n </head>\\n\\n <body onload="embedDashboard()">\\n\\n <div style="text-align: center; width: 1024px;">\\n <h2>Amazon QuickSight Multilingual Embedded Dashboard</h2>\\n\\n <span>\\n <label for="lang">Language</label>\\n <select id="lang" name="lang" onchange="onLangChange(this)">\\n <option value="en_US" selected>English</option>\\n <option value="de_DE">German</option>\\n <option value="it_IT">Italian</option>\\n <option value="es_ES">Spanish</option>\\n </select>\\n </span>\\n\\n &nbsp;-&nbsp;\\n \\n <span>\\n <label for="changeLocale">Sync UI Locale with Language</label>\\n <input type="checkbox" id="changeLocale" name="changeLocale" onchange="onSyncLocaleChange(this)">\\n </span>\\n\\n &nbsp;|&nbsp;\\n\\n <span>\\n <label for="locale">QuickSight UI Locale</label>\\n <select id="locale" name="locale" onchange="onLocaleChange(this)">\\n <option value="en-US" selected>English</option>\\n <option value="da-DK">Dansk</option>\\n <option value="de-DE">Deutsch</option>\\n <option value="ja-JP">日本語</option>\\n <option value="es-ES">Español</option>\\n <option value="fr-FR">Français</option>\\n <option value="it-IT">Italiano</option>\\n <option value="nl-NL">Nederlands</option>\\n <option value="nb-NO">Norsk</option>\\n <option value="pt-BR">Português</option>\\n <option value="fi-FI">Suomi</option>\\n <option value="sv-SE">Svenska</option>\\n <option value="ko-KR">한국어</option>\\n <option value="zh-CN">中文 (简体)</option>\\n <option value="zh-TW">中文 (繁體)</option> \\n </select>\\n </span>\\n </div>\\n\\n <div id="embeddingContainer"></div>\\n\\n </body>\\n\\n</html>\\n</code></pre>\\n<h5><a id=\\"About_the_Author_575\\"></a><strong>About the Author</strong></h5>\\n<p><img src=\\"https://dev-media.amazoncloud.cn/f9999c4cab214d3e81d212ddfe100268_image.png\\" alt=\\"image.png\\" /></p>\n<p><strong>Francesco Marelli</strong> is a principal solutions architect at Amazon Web Services. He is specialized in the design and implementation of analytics, data management, and big data systems. Francesco also has a strong experience in systems integration and design and implementation of applications. He is passionate about music, collecting vinyl records, and playing bass.</p>\n"}
Build a multilingual dashboard with Amazon Athena and Amazon QuickSight
海外精选

海外精选的内容汇集了全球优质的亚马逊云科技相关技术内容。同时,内容中提到的“AWS”
是 “Amazon Web Services” 的缩写,在此网站不作为商标展示。

 0
0 0
0亚马逊云科技解决方案 基于行业客户应用场景及技术领域的解决方案
联系亚马逊云科技专家
亚马逊云科技解决方案
基于行业客户应用场景及技术领域的解决方案
联系专家

0
目录

 分享
分享 点赞
点赞 收藏
收藏 目录
目录立即注册,开启您的免费套餐
立即关注

亚马逊云开发者
公众号

User Group
公众号

亚马逊云科技
官方小程序
“AWS” 是 “Amazon Web Services” 的缩写,在此网站不作为商标展示。
立即关注
亚马逊云开发者
公众号
User Group
公众号
亚马逊云科技
官方小程序
“AWS” 是 “Amazon Web Services” 的缩写,在此网站不作为商标展示。
关于我们 
更多资源
开发者工具
更多支持
立即关注
亚马逊云开发者
公众号
User Group
公众号
亚马逊云科技
官方小程序
“AWS” 是 “Amazon Web Services” 的缩写,在此网站不作为商标展示。
