{"value":"<p><a href=\"https://aws.amazon.com/quicksight\" target=\"_blank\" rel=\"noopener noreferrer\">Amazon QuickSight</a> is cloud-native business intelligence (BI) service. QuickSight automatically optimizes queries and execution to help dashboards load quickly, but you can make your dashboard loads even faster and make sure you’re getting the best possible performance by following the tips and tricks outlined in this post.</p>\n\n### **Data flow and execution of QuickSight dashboard loads**\n\n<p>The data flow in QuickSight starts from the client browser to the web server and then flows to the QuickSight engine, which in some cases executes queries against SPICE—a Super-fast, Parallel, In-memory Calculation Engine—or in other cases directly against the database. SPICE uses a combination of columnar storage, in-memory technologies enabled through the latest hardware innovations, and machine code generation to run interactive queries on large datasets and get rapid responses.</p>\n<p>The web server, QuickSight engine, and SPICE are auto scaled by QuickSight. This is a fully managed service—you don’t need to worry about provisioning or managing infrastructure when you want to scale up a particular dashboard from tens to thousands of users on SPICE. Dashboards built against direct query data sources may require provisioning or managing infrastructure on the customer side.</p>\nThe following diagram illustrates the data flow:\n\n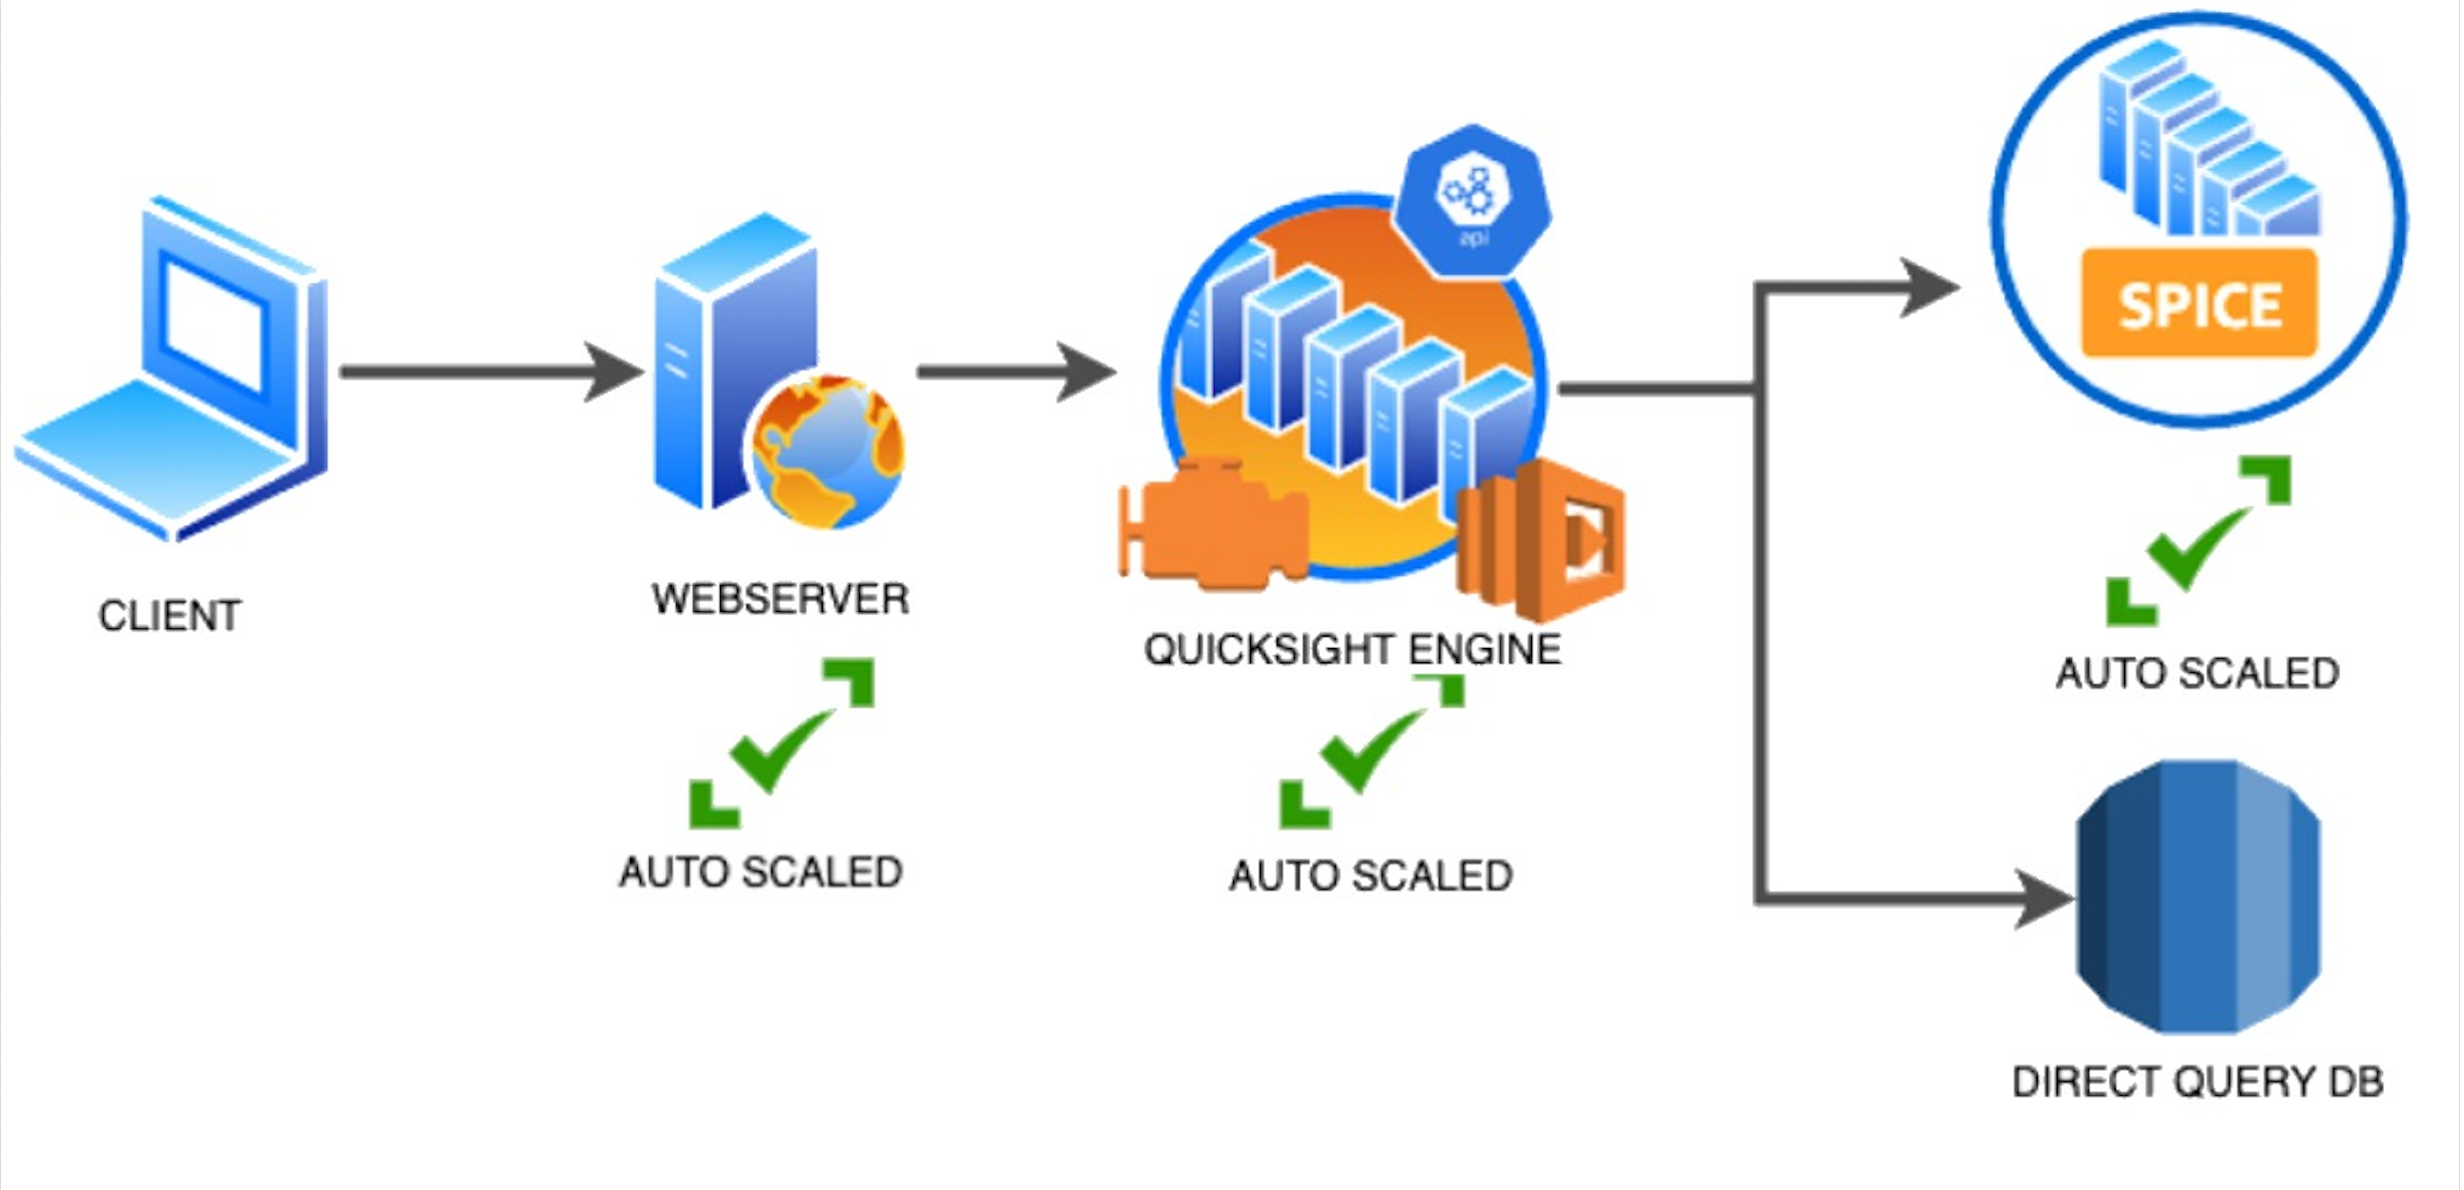\n\n<p>Let’s look at the general execution process to understand the implications:</p>\n<ul> \n <li>A request is triggered in the browser, leading to several static assets such as JavaScript, fonts, and images being downloaded.</li> \n <li>All the metadata (such as visual configurations and layout) is fetched for the dashboard.</li> \n <li>Queries are performed, which may include setting up row-level and column-level security, or fetching dynamic control values, default parameters, and all values of drop-downs in filter controls.</li> \n <li>Up to your concurrency limit, the queries to render your visuals run in a specific sequence (described later in this post). If you’re using SPICE, the concurrency of queries is much higher. Pagination within visuals may lead to additional queries.</li> \n </ul>\n<p>The actual execution is more complex and depends on how dashboards are configured and other factors such as the data source types, Direct Query vs. SPICE, cardinality of fields and how often data is getting refreshed etc. Many operations run in parallel and all visual-related queries are run via WebSocket, as shown in the following screenshot. Many of the steps run in the end-user’s browser, therefore there are limitations such as the number of sequences and workloads that can be pushed onto the browser. Performance may also be slightly different based on the browser type because each browser handles contention differently.</p>\n\n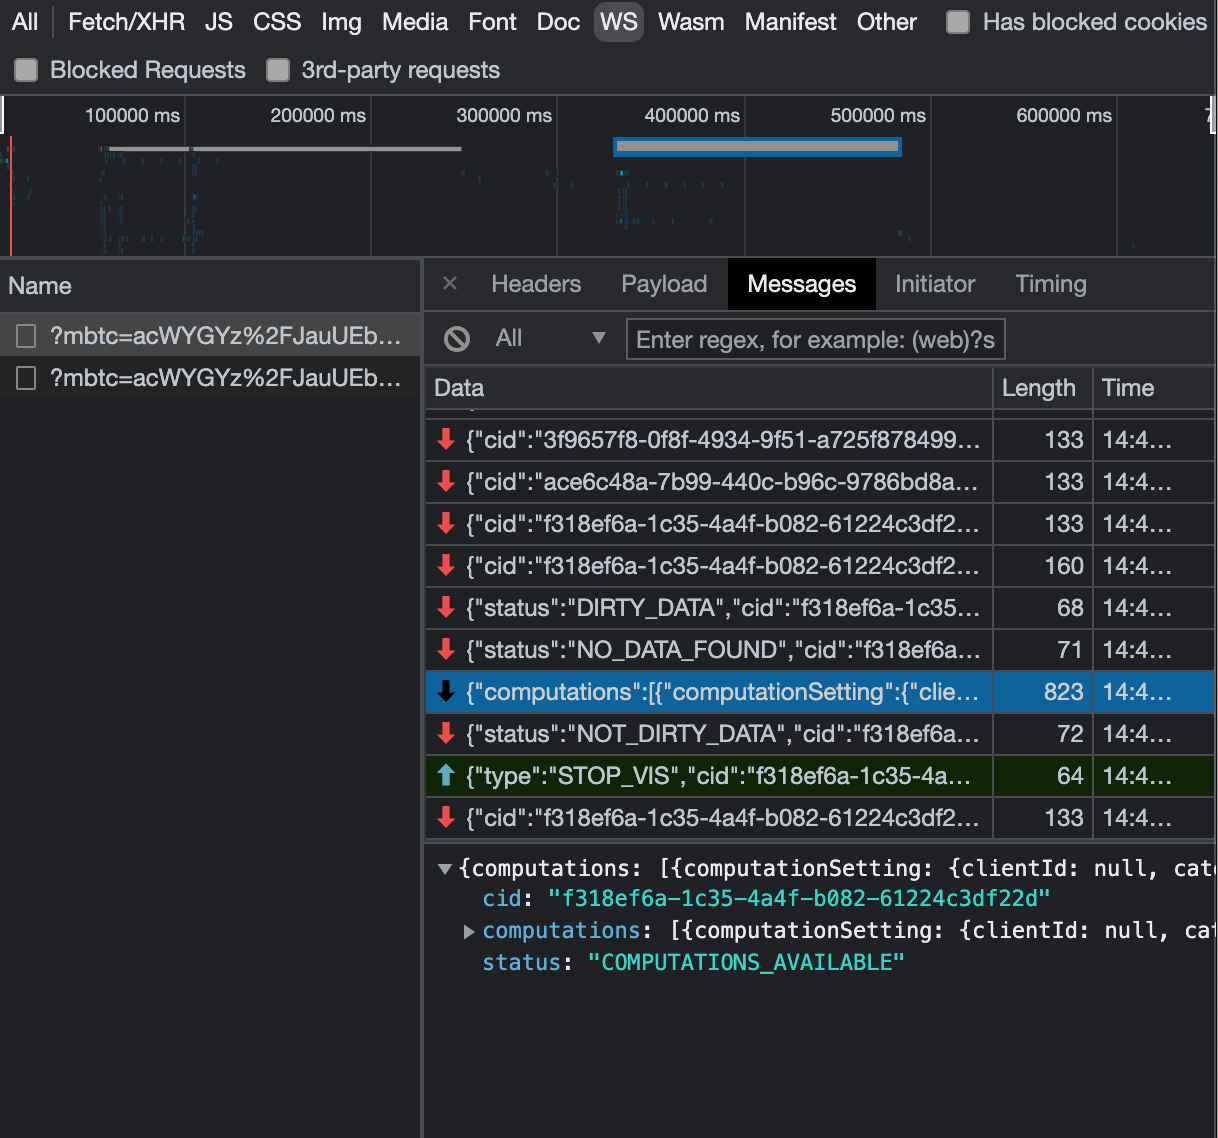\n<p>Now let’s look at many great tips that can improve your dashboard’s performance!</p>\n\n### **SPICE**\n\n<p>Utilizing the capabilities of SPICE when possible is a great way to boost overall performance because SPICE manages scaling as well as caching results for you. We recommend using SPICE whenever possible.</p>\n\n### **Metadata**\n\n<p>As seen in the preceding execution sequence, QuickSight fetches metadata up front for a given dashboard during the initial load. We recommend the following actions regarding metadata.</p>\n\n#### **Remove unused datasets from analysis**\n\n<p>Datasets that may have been used in the past but have no visual associated with the dashboard anymore add to the metadata payload unnecessarily. It’s likely to impact to dashboard performance.</p>\n\n#### **Make sure your row-level and column-level security is performant**\n\n<p>Row-Level security, column-level security and dynamic default parameters each require lookups to take place before the visual queries are issued. When possible, try to limit the number and the complexity of your rules datasets to help these lookups execute faster. Use SPICE for your rules dataset when possible. If you must use a direct query, make sure that the queries are optimal and that the data source you’re querying is scaled appropriately up front.</p>\n<p>For embedded dashboards, a great way to optimize row-level security lookups is by utilizing <a href=\"https://docs.aws.amazon.com/quicksight/latest/user/quicksight-dev-rls-tags.html\" target=\"_blank\" rel=\"noopener noreferrer\">session tags for row-level security</a> paired with an anonymous identity. Similarly, dynamic default parameters, if used, can be evaluated in the host application up front and passed using the embedding SDK.</p>\n\n### **Calculated functions**\n\n<p>In this section, we offer tips regarding calculated functions.</p>\n\n### **Move calculations to the data prep stage**\n\n<p>QuickSight allows you to add calculated fields in the data prep or analysis experiences. We strongly encourage you to move as many calculations as possible to the data prep stage which will allow QuickSight to materialize calculations which do not contain aggregation or parameters into the SPICE dataset. Materializing calculated fields in the dataset helps you reduce the runtime calculations, which improves query performance. Even if you are using aggregation or parameters in your calculation, it might still be possible to move parts of the calculations to data prep. For instance, if you have a formula like the following:</p>\n<p><a href=\"https://d2908q01vomqb2.cloudfront.net/b6692ea5df920cad691c20319a6fffd7a4a766b8/2022/05/17/BDB-2141-image013.png\">\n\n</a></p>\n<p>You can remove the <code>sum()</code> and just keep the <code>ifelse()</code>, which will allow QuickSight to materialize (precompute) it and save it as a real field in your SPICE dataset. Then you can either add another calculation which sums it up, or just use sum aggregation once you add it to your visuals.</p>\n<p>Generally materializing calculations that use complex <code>ifelse</code> logic or do string manipulation/lookups will result in the greatest improvements in dashboard performance.</p>\n\n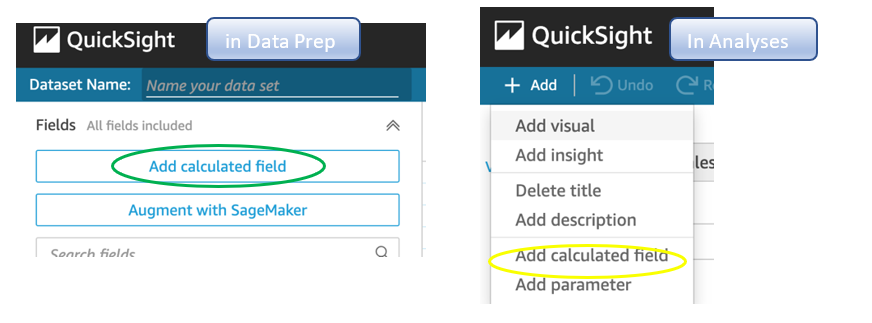\n\n#### **Implement the simplified ifelse syntax**\n\n<p>The <code>ifelse</code> function supports simplified statements. For example, you might start with the following statement:</p>\n\n\nThe following simplified statement is more performant:\n\n\n\n#### **Use the toString() function judiciously**\n\n<p>The <code>toString()</code> function has a much lower performance and is much heavier on the database engine than a simple integer or number-based arithmatic calculations. Therefore, you should use it sparingly.</p>\n\n#### **Know when nulls are returned by the system and use null value customization**\n\n<p>Most authors make sure that null conditions on calculated fields are handled gracefully. QuickSight often handles nulls gracefully for you. You can use that to your advantage and make the calculations simpler. In the following example, the division by 0 is already handled by QuickSight:</p>\n\n\n\n<p>You can write the preceding code as the following:</p>\n\n\n<p>If you need to represent nulls on visuals with a static string, QuickSight allows you to set custom values when a null value is returned in a visual configuration. In the preceding example, you could just set a custom value of 0 in the formatting option. Removing such handling from the calculated fields can significantly help query performance.<br> <a href=\"https://d2908q01vomqb2.cloudfront.net/b6692ea5df920cad691c20319a6fffd7a4a766b8/2022/03/09/BDB-2141-image005.png\">\n\n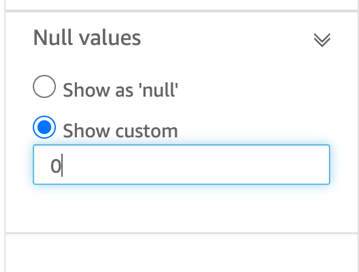</a></p>\n\n### **On-sheet filters vs. parameters**\n\n<p>Parameters are seemingly a very simple construct but they can quickly get complicated, especially when used in nested calculation functions or when used in controls. Parameters are all evaluated on the fly, forcing all the dependencies to be handled real time. Ask yourself if each parameter is really required. In some cases, you may be able to replace them with simple dropdown control, as shown in the following example for <code>$market</code>.<br> <a href=\"https://d2908q01vomqb2.cloudfront.net/b6692ea5df920cad691c20319a6fffd7a4a766b8/2022/05/17/BDB-2141-code5-1.png\">\n\n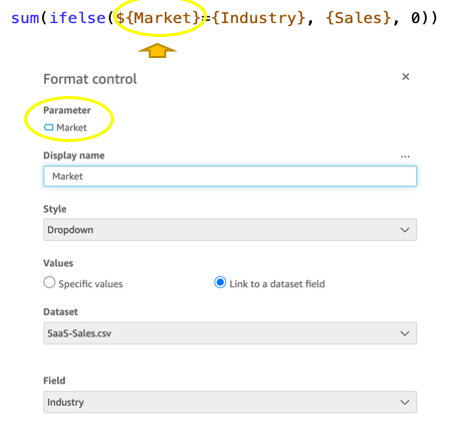</a><br> Instead of creating a control parameter to use in a calculated field, you might be able to use the field with a dropdown filter control.</p>\n\n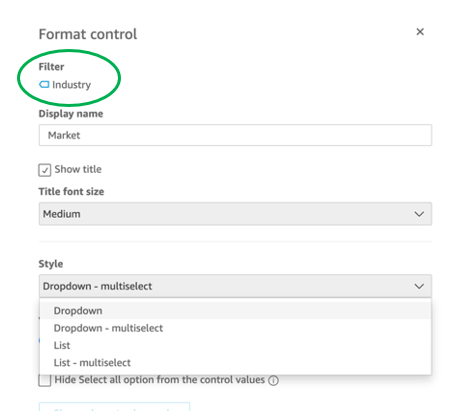\n\n### **Text field vs. Dropdown (or List) filter controls**\n\n<p>When you are designing an analysis, you can add a filter control for the visuals you want to filter. if the data type of the field is string, you have several choices for the type of control filter. Text field which displays a text box where you can enter a single entry or multiple entries is suggested for the better performance, rather than Dropdown (or List) which requires to fetch the values to populate a list that you can select a single or multiple values.</p>\n\n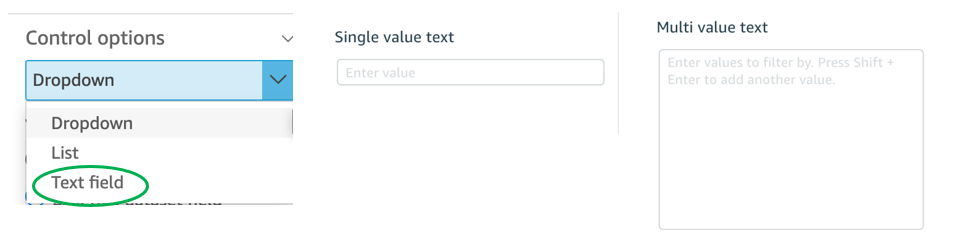\n\n### **On-sheet controls**\n\n<p>The control panel at the top of the dashboard is collapsible by default, but this setting allows you to have an expanded state while publishing the dashboard. If this setting is enabled, QuickSight prioritizes the calls in order to fetch the controls’ values before the visual loads. If any of the controls have high cardinality, it could impact the performance of loading the dashboard. Evaluate this need against the fact that QuickSight persists last-used control values and the reader might not actually need to adjust controls as a first step.</p>\n\n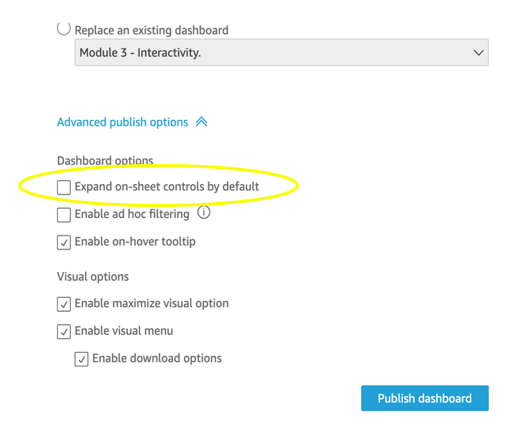\n\n### **Visual types: Charts**\n\n<p>In this section, we provide advice when using Charts.</p>\n\n#### **‘Hide the “other” category’ when your dimension has less than the cutoff limit**\n\n<p>You can choose to limit how many data points you want to display in your visual, before they are added to the <em>other </em>category. This category contains the aggregated data for all the data beyond the cutoff limit for the visual type you are using – either the one you impose or the one based on display limits. If you know your dimension has less than the cutoff limit, use this option. This will improve your dashboard performance.</p>\n\n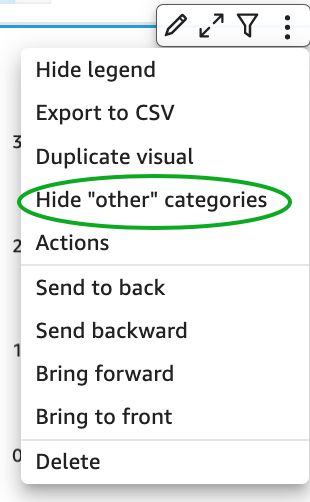\n<p>The <em>other</em> category does not show on scatter plots, heat maps, maps, tables (tabular reports), or key performance indicators (KPIs). It also doesn’t show on line charts when the x-axis is a date.</p>\n\n### **Visual types: Tables and pivot tables**\n\n<p>In this section, we provide advice when using tables and pivot tables.</p>\n\n#### **Use the Values field well when displaying a raw table view**\n\n<p>If you want to output all the raw data into table, you can use <strong>Group by</strong> fields, <strong>Values</strong> fields, or a mix of them. The most performant approach is set every field into <strong>Values</strong>. When using <strong>Group by</strong>, a query is first run under the hood followed by the Group by function, therefore all the data is pulled from the database, which is expensive.</p>\n\n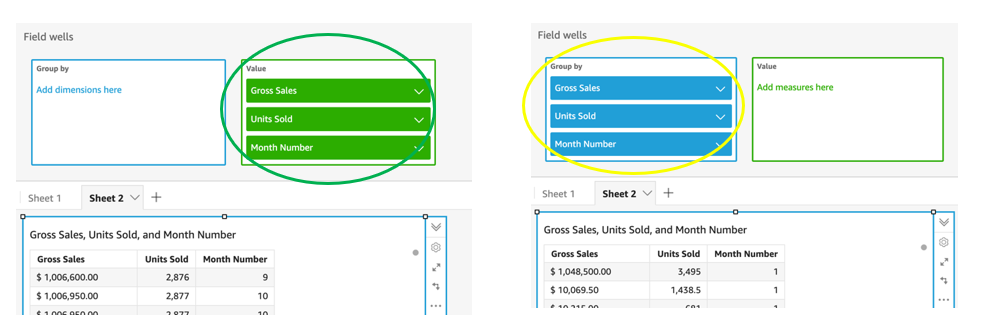\n\n#### **Deploy a minimal set of rows, columns, metrics, and table calculations**\n\n<p>If you include too many combinations of rows, columns, metrics, and table calculations in one pivot table, you risk overwhelming the viewer. You can also run into the computational limitations of the underlying database. To reduce the level of complexity and potential errors, you can take the following actions:</p>\n<ul> \n <li>Apply filters to reduce the data included in for the visual</li> \n <li>Use fewer fields in the <strong>Row</strong> and <strong>Column</strong> field wells</li> \n <li>Use as few fields as possible in the <strong>Values</strong> field well</li> \n <li>Create additional pivot tables so that each displays fewer metrics</li> \n <li>Reduce subtotals, totals and conditional formatting when possible</li> \n </ul>\n<p>Uncollapsed columns are always the simplest case and will likely remain more performant outside of a few cases.</p>\n\n### **Visual queries sequence**\n\n<p>The execution of the individual visual sequence is left to right, then top to bottom. Understanding the sequence of execution can be helpful: you can rearrange visuals on your dashboard without losing the context. Place heavier visuals further down in the dashboard, and place lightweight KPI and insight visuals near the top to display “above-the-fold” content sooner, which improves the dashboard performance’s perception for your readers.</p>\n\n### **Embedding**\n\n<p>Our final set of recommendations are in regards to embedding.</p>\n\n#### **Remove user management flows from the critical path**\n\n<p>Most times, user management and authentication flows (such as <code>DescribeUser</code> and <code>RegisterUser</code> APIs) can run asynchronously on the host application.</p>\n<p>Consider registering the user in advance before the actual embedding, so that the overhead is removed from every analytics page visit.</p>\n<p>Authenticate the user on your website in advance, and acquire any <a href=\"///Users/wakanavs/Downloads/aws.amazon.com/cognito\" target=\"_blank\" rel=\"noopener noreferrer\">Amazon Cognito</a> or <a href=\"https://docs.aws.amazon.com/STS/latest/APIReference/welcome.html\" target=\"_blank\" rel=\"noopener noreferrer\">AWS Security Token Service</a> (Amazon STS) session tokens (if required) in advance (for example, at user login time or home page visit). This reduces additional runtime latency overhead when a user visits an analytics page.</p>\n\n#### **Move workloads from clients to the web server or backend services**\n\n<p>If a QuickSight dashboard is embedded on a webpage on the host application, which performs other activities too, play close attention to the sequence of API calls on the host. The QuickSight dashboard load might be gated by other heavy API calls on the host application. Move the logic to the web server or backend services as much as possible to limit contention on the browser.</p>\n\n#### **Don’t tear down the embedding iFrame when the user navigates away from analytics section**\n\n<p>When the user moves temporarily to a non-analytics page of your web application (especially in single-page applications), instead of removing the embedding iframe from DOM, you can hide it from the user while keeping the iFrame in the page DOM elements. This allows you to resume the same session when the user navigates back to analytics section of your application, and they don’t need to wait for reload.</p>\n\n#### **Use navigateToDashboard() and navigateToSheet() whenever possible**\n\n<p>If you have multiple dashboards on your host application that don’t need to load concurrently, you can optimize the authentication flow by utilizing two APIs we expose, <code>navigateToDashboard()</code> or <code>navigateToSheet()</code>, in our JavaScript SDK. These APIs reuse the same iFrame for each load, while reusing the authentication token.</p>\n<p>This technique has proven to be very effective for many of our embedding users.</p>\n<p>For more information about these APIs, refer to <a href=\"https://www.npmjs.com/package/amazon-quicksight-embedding-sdk\" target=\"_blank\" rel=\"noopener noreferrer\">Amazon QuickSight Embedding SDK</a>.</p>\n\n### **Conclusion**\n\n<p>In this post, we shared some tips and tricks for tuning the performance of your QuickSight dashboards. In 2021, we doubled our SPICE data limits to 500 million rows of data per dataset. In addition, incremental data refresh is available for SQL-based data sources such as <a href=\"http://aws.amazon.com/redshift\" target=\"_blank\" rel=\"noopener noreferrer\">Amazon Redshift</a>, <a href=\"http://aws.amazon.com/athena\" target=\"_blank\" rel=\"noopener noreferrer\">Amazon Athena</a>, <a href=\"https://aws.amazon.com/rds/\" target=\"_blank\" rel=\"noopener noreferrer\">Amazon RDS</a>, <a href=\"https://aws.amazon.com/rds/aurora/\" target=\"_blank\" rel=\"noopener noreferrer\">Amazon Aurora</a>, PostgreSQL, MySQL, Oracle, SQL Server, MariaDB, Presto, Teradata or Snowflake up to every 15 minutes, which cuts down time between data updates by 75%. In 2022, we continue to innovate on your behalf to make QuickSight dashboard loads even more performant.</p>\n<p>We look forward to your feedback on how these tips and tricks helped your dashboards load faster.</p>\n\n#### **About the Authors**\n\n\n<p style=\"clear: both\"><strong> Shekhar Kopuri</strong> is a Senior Software Development Manager for Amazon QuickSight. He leads the front platform engineering team that focusses on various aspects of front end experience including website performance. Before joining AWS, Shekhar led development of multiple provisioning and activation network OSS applications for a large global telecommunications service provider.</p>\n\n\n<p style=\"clear: both\"><strong>Blake Carroll</strong> is a Senior Frontend Engineer for Amazon QuickSight. He works with the frontend platform engineering team with a focus on website performance and has previously been the frontend lead for initial reporting and theming functionality in QuickSight. Prior to joining Amazon, Blake was a co-founder in the digital interactive agency space working with national brands to produce creative web experiences.</p>\n\n\n<p style=\"clear: both\"><strong>Vijay Chaudhari</strong> is a Senior Software Development Engineer for Amazon QuickSight, AWS’ cloud-native, fully managed BI service. Vijay started his career with IBM, writing software for the Information Management group. At Amazon, he has built backend applications for retail systems, and near real-time data pre-computation, reporting and analytics systems at Amazon scale. He is passionate about learning and solving new customer problems, and helping them adopt cloud native technologies.</p>\n\n\n<p style=\"clear: both\"><strong>Wakana Vilquin-Sakashita</strong> is Specialist Solution Architect for Amazon QuickSight. She works closely with customers to help making sense of the data through visualization. Previously Wakana worked for S&P Global assisting customers to access data, insights and researches relevant for their business.</p>","render":"<p><a href=\"https://aws.amazon.com/quicksight\" target=\"_blank\">Amazon QuickSight</a> is cloud-native business intelligence (BI) service. QuickSight automatically optimizes queries and execution to help dashboards load quickly, but you can make your dashboard loads even faster and make sure you’re getting the best possible performance by following the tips and tricks outlined in this post.</p>\n<h3><a id=\"Data_flow_and_execution_of_QuickSight_dashboard_loads_2\"></a><strong>Data flow and execution of QuickSight dashboard loads</strong></h3>\n<p>The data flow in QuickSight starts from the client browser to the web server and then flows to the QuickSight engine, which in some cases executes queries against SPICE—a Super-fast, Parallel, In-memory Calculation Engine—or in other cases directly against the database. SPICE uses a combination of columnar storage, in-memory technologies enabled through the latest hardware innovations, and machine code generation to run interactive queries on large datasets and get rapid responses.</p>\n<p>The web server, QuickSight engine, and SPICE are auto scaled by QuickSight. This is a fully managed service—you don’t need to worry about provisioning or managing infrastructure when you want to scale up a particular dashboard from tens to thousands of users on SPICE. Dashboards built against direct query data sources may require provisioning or managing infrastructure on the customer side.</p>\nThe following diagram illustrates the data flow:\n<p><img src=\"https://dev-media.amazoncloud.cn/fbf91192f7164e5c9edef8f24d131f87_image.png\" alt=\"image.png\" /></p>\n<p>Let’s look at the general execution process to understand the implications:</p>\n<ul> \n <li>A request is triggered in the browser, leading to several static assets such as JavaScript, fonts, and images being downloaded.</li> \n <li>All the metadata (such as visual configurations and layout) is fetched for the dashboard.</li> \n <li>Queries are performed, which may include setting up row-level and column-level security, or fetching dynamic control values, default parameters, and all values of drop-downs in filter controls.</li> \n <li>Up to your concurrency limit, the queries to render your visuals run in a specific sequence (described later in this post). If you’re using SPICE, the concurrency of queries is much higher. Pagination within visuals may lead to additional queries.</li> \n </ul>\n<p>The actual execution is more complex and depends on how dashboards are configured and other factors such as the data source types, Direct Query vs. SPICE, cardinality of fields and how often data is getting refreshed etc. Many operations run in parallel and all visual-related queries are run via WebSocket, as shown in the following screenshot. Many of the steps run in the end-user’s browser, therefore there are limitations such as the number of sequences and workloads that can be pushed onto the browser. Performance may also be slightly different based on the browser type because each browser handles contention differently.</p>\n<p><img src=\"https://dev-media.amazoncloud.cn/33ecb571ae5e46cc9004418bb6e1f8bd_image.png\" alt=\"image.png\" /></p>\n<p>Now let’s look at many great tips that can improve your dashboard’s performance!</p>\n<h3><a id=\"SPICE_22\"></a><strong>SPICE</strong></h3>\n<p>Utilizing the capabilities of SPICE when possible is a great way to boost overall performance because SPICE manages scaling as well as caching results for you. We recommend using SPICE whenever possible.</p>\n<h3><a id=\"Metadata_26\"></a><strong>Metadata</strong></h3>\n<p>As seen in the preceding execution sequence, QuickSight fetches metadata up front for a given dashboard during the initial load. We recommend the following actions regarding metadata.</p>\n<h4><a id=\"Remove_unused_datasets_from_analysis_30\"></a><strong>Remove unused datasets from analysis</strong></h4>\n<p>Datasets that may have been used in the past but have no visual associated with the dashboard anymore add to the metadata payload unnecessarily. It’s likely to impact to dashboard performance.</p>\n<h4><a id=\"Make_sure_your_rowlevel_and_columnlevel_security_is_performant_34\"></a><strong>Make sure your row-level and column-level security is performant</strong></h4>\n<p>Row-Level security, column-level security and dynamic default parameters each require lookups to take place before the visual queries are issued. When possible, try to limit the number and the complexity of your rules datasets to help these lookups execute faster. Use SPICE for your rules dataset when possible. If you must use a direct query, make sure that the queries are optimal and that the data source you’re querying is scaled appropriately up front.</p>\n<p>For embedded dashboards, a great way to optimize row-level security lookups is by utilizing <a href=\"https://docs.aws.amazon.com/quicksight/latest/user/quicksight-dev-rls-tags.html\" target=\"_blank\">session tags for row-level security</a> paired with an anonymous identity. Similarly, dynamic default parameters, if used, can be evaluated in the host application up front and passed using the embedding SDK.</p>\n<h3><a id=\"Calculated_functions_39\"></a><strong>Calculated functions</strong></h3>\n<p>In this section, we offer tips regarding calculated functions.</p>\n<h3><a id=\"Move_calculations_to_the_data_prep_stage_43\"></a><strong>Move calculations to the data prep stage</strong></h3>\n<p>QuickSight allows you to add calculated fields in the data prep or analysis experiences. We strongly encourage you to move as many calculations as possible to the data prep stage which will allow QuickSight to materialize calculations which do not contain aggregation or parameters into the SPICE dataset. Materializing calculated fields in the dataset helps you reduce the runtime calculations, which improves query performance. Even if you are using aggregation or parameters in your calculation, it might still be possible to move parts of the calculations to data prep. For instance, if you have a formula like the following:</p>\n<p><a href=\"https://d2908q01vomqb2.cloudfront.net/b6692ea5df920cad691c20319a6fffd7a4a766b8/2022/05/17/BDB-2141-image013.png\">\n<p><img src=\"https://dev-media.amazoncloud.cn/ebe286a9b6094f869e6bda5f6865247e_image.png\" alt=\"image.png\" /></a></p></p>\n<p>You can remove the <code>sum()</code> and just keep the <code>ifelse()</code>, which will allow QuickSight to materialize (precompute) it and save it as a real field in your SPICE dataset. Then you can either add another calculation which sums it up, or just use sum aggregation once you add it to your visuals.</p>\n<p>Generally materializing calculations that use complex <code>ifelse</code> logic or do string manipulation/lookups will result in the greatest improvements in dashboard performance.</p>\n<p><img src=\"https://dev-media.amazoncloud.cn/970d6637f71645b5af29f3dffda6997a_image.png\" alt=\"image.png\" /></p>\n<h4><a id=\"Implement_the_simplified_ifelse_syntax_54\"></a><strong>Implement the simplified ifelse syntax</strong></h4>\n<p>The <code>ifelse</code> function supports simplified statements. For example, you might start with the following statement:</p>\n<p><img src=\"https://dev-media.amazoncloud.cn/229ad7a725424a1ea7112b15a2535ad2_image.png\" alt=\"image.png\" /><br />\nThe following simplified statement is more performant:</p>\n<p><img src=\"https://dev-media.amazoncloud.cn/2db673e2ba3143aa8e101cf22bcb0dcf_image.png\" alt=\"image.png\" /></p>\n<h4><a id=\"Use_the_toString_function_judiciously_63\"></a><strong>Use the toString() function judiciously</strong></h4>\n<p>The <code>toString()</code> function has a much lower performance and is much heavier on the database engine than a simple integer or number-based arithmatic calculations. Therefore, you should use it sparingly.</p>\n<h4><a id=\"Know_when_nulls_are_returned_by_the_system_and_use_null_value_customization_67\"></a><strong>Know when nulls are returned by the system and use null value customization</strong></h4>\n<p>Most authors make sure that null conditions on calculated fields are handled gracefully. QuickSight often handles nulls gracefully for you. You can use that to your advantage and make the calculations simpler. In the following example, the division by 0 is already handled by QuickSight:</p>\n<p><img src=\"https://dev-media.amazoncloud.cn/3a03c70bbf304a6c9d5f74935eb4f581_image.png\" alt=\"image.png\" /></p>\n<p>You can write the preceding code as the following:</p>\n<p><img src=\"https://dev-media.amazoncloud.cn/a2919c53ce4a4d9a8d0d18177d07f3d8_image.png\" alt=\"image.png\" /></p>\n<p>If you need to represent nulls on visuals with a static string, QuickSight allows you to set custom values when a null value is returned in a visual configuration. In the preceding example, you could just set a custom value of 0 in the formatting option. Removing such handling from the calculated fields can significantly help query performance.<br> <a href=\"https://d2908q01vomqb2.cloudfront.net/b6692ea5df920cad691c20319a6fffd7a4a766b8/2022/03/09/BDB-2141-image005.png\">\n<p><img src=\"https://dev-media.amazoncloud.cn/e3a689a23f59431894020ab719654654_image.png\" alt=\"image.png\" /></a></p></p>\n<h3><a id=\"Onsheet_filters_vs_parameters_80\"></a><strong>On-sheet filters vs. parameters</strong></h3>\n<p>Parameters are seemingly a very simple construct but they can quickly get complicated, especially when used in nested calculation functions or when used in controls. Parameters are all evaluated on the fly, forcing all the dependencies to be handled real time. Ask yourself if each parameter is really required. In some cases, you may be able to replace them with simple dropdown control, as shown in the following example for <code>$market</code>.<br> <a href=\"https://d2908q01vomqb2.cloudfront.net/b6692ea5df920cad691c20319a6fffd7a4a766b8/2022/05/17/BDB-2141-code5-1.png\">\n<p><img src=\"https://dev-media.amazoncloud.cn/38c552e7130e4deeb5b105298e81213a_image.png\" alt=\"image.png\" /></a><br> Instead of creating a control parameter to use in a calculated field, you might be able to use the field with a dropdown filter control.</p></p>\n<p><img src=\"https://dev-media.amazoncloud.cn/61da25da2b9d44e5b19a536ee74afac3_image.png\" alt=\"image.png\" /></p>\n<h3><a id=\"Text_field_vs_Dropdown_or_List_filter_controls_88\"></a><strong>Text field vs. Dropdown (or List) filter controls</strong></h3>\n<p>When you are designing an analysis, you can add a filter control for the visuals you want to filter. if the data type of the field is string, you have several choices for the type of control filter. Text field which displays a text box where you can enter a single entry or multiple entries is suggested for the better performance, rather than Dropdown (or List) which requires to fetch the values to populate a list that you can select a single or multiple values.</p>\n<p><img src=\"https://dev-media.amazoncloud.cn/e5936f5e49b54c51a84722ef0c99cbf4_image.png\" alt=\"image.png\" /></p>\n<h3><a id=\"Onsheet_controls_94\"></a><strong>On-sheet controls</strong></h3>\n<p>The control panel at the top of the dashboard is collapsible by default, but this setting allows you to have an expanded state while publishing the dashboard. If this setting is enabled, QuickSight prioritizes the calls in order to fetch the controls’ values before the visual loads. If any of the controls have high cardinality, it could impact the performance of loading the dashboard. Evaluate this need against the fact that QuickSight persists last-used control values and the reader might not actually need to adjust controls as a first step.</p>\n<p><img src=\"https://dev-media.amazoncloud.cn/a3a6181582d5455ab039ef703a7a7900_image.png\" alt=\"image.png\" /></p>\n<h3><a id=\"Visual_types_Charts_100\"></a><strong>Visual types: Charts</strong></h3>\n<p>In this section, we provide advice when using Charts.</p>\n<h4><a id=\"Hide_the_other_category_when_your_dimension_has_less_than_the_cutoff_limit_104\"></a><strong>‘Hide the “other” category’ when your dimension has less than the cutoff limit</strong></h4>\n<p>You can choose to limit how many data points you want to display in your visual, before they are added to the <em>other </em>category. This category contains the aggregated data for all the data beyond the cutoff limit for the visual type you are using – either the one you impose or the one based on display limits. If you know your dimension has less than the cutoff limit, use this option. This will improve your dashboard performance.</p>\n<p><img src=\"https://dev-media.amazoncloud.cn/0e293453583f4a5c9282a2d6b494a036_image.png\" alt=\"image.png\" /></p>\n<p>The <em>other</em> category does not show on scatter plots, heat maps, maps, tables (tabular reports), or key performance indicators (KPIs). It also doesn’t show on line charts when the x-axis is a date.</p>\n<h3><a id=\"Visual_types_Tables_and_pivot_tables_111\"></a><strong>Visual types: Tables and pivot tables</strong></h3>\n<p>In this section, we provide advice when using tables and pivot tables.</p>\n<h4><a id=\"Use_the_Values_field_well_when_displaying_a_raw_table_view_115\"></a><strong>Use the Values field well when displaying a raw table view</strong></h4>\n<p>If you want to output all the raw data into table, you can use <strong>Group by</strong> fields, <strong>Values</strong> fields, or a mix of them. The most performant approach is set every field into <strong>Values</strong>. When using <strong>Group by</strong>, a query is first run under the hood followed by the Group by function, therefore all the data is pulled from the database, which is expensive.</p>\n<p><img src=\"https://dev-media.amazoncloud.cn/359c5c3bf3914f3f9b541e6cfb09f054_image.png\" alt=\"image.png\" /></p>\n<h4><a id=\"Deploy_a_minimal_set_of_rows_columns_metrics_and_table_calculations_121\"></a><strong>Deploy a minimal set of rows, columns, metrics, and table calculations</strong></h4>\n<p>If you include too many combinations of rows, columns, metrics, and table calculations in one pivot table, you risk overwhelming the viewer. You can also run into the computational limitations of the underlying database. To reduce the level of complexity and potential errors, you can take the following actions:</p>\n<ul> \n <li>Apply filters to reduce the data included in for the visual</li> \n <li>Use fewer fields in the <strong>Row</strong> and <strong>Column</strong> field wells</li> \n <li>Use as few fields as possible in the <strong>Values</strong> field well</li> \n <li>Create additional pivot tables so that each displays fewer metrics</li> \n <li>Reduce subtotals, totals and conditional formatting when possible</li> \n </ul>\n<p>Uncollapsed columns are always the simplest case and will likely remain more performant outside of a few cases.</p>\n<h3><a id=\"Visual_queries_sequence_133\"></a><strong>Visual queries sequence</strong></h3>\n<p>The execution of the individual visual sequence is left to right, then top to bottom. Understanding the sequence of execution can be helpful: you can rearrange visuals on your dashboard without losing the context. Place heavier visuals further down in the dashboard, and place lightweight KPI and insight visuals near the top to display “above-the-fold” content sooner, which improves the dashboard performance’s perception for your readers.</p>\n<h3><a id=\"Embedding_137\"></a><strong>Embedding</strong></h3>\n<p>Our final set of recommendations are in regards to embedding.</p>\n<h4><a id=\"Remove_user_management_flows_from_the_critical_path_141\"></a><strong>Remove user management flows from the critical path</strong></h4>\n<p>Most times, user management and authentication flows (such as <code>DescribeUser</code> and <code>RegisterUser</code> APIs) can run asynchronously on the host application.</p>\n<p>Consider registering the user in advance before the actual embedding, so that the overhead is removed from every analytics page visit.</p>\n<p>Authenticate the user on your website in advance, and acquire any <a href=\"///Users/wakanavs/Downloads/aws.amazon.com/cognito\" target=\"_blank\">Amazon Cognito</a> or <a href=\"https://docs.aws.amazon.com/STS/latest/APIReference/welcome.html\" target=\"_blank\">AWS Security Token Service</a> (Amazon STS) session tokens (if required) in advance (for example, at user login time or home page visit). This reduces additional runtime latency overhead when a user visits an analytics page.</p>\n<h4><a id=\"Move_workloads_from_clients_to_the_web_server_or_backend_services_147\"></a><strong>Move workloads from clients to the web server or backend services</strong></h4>\n<p>If a QuickSight dashboard is embedded on a webpage on the host application, which performs other activities too, play close attention to the sequence of API calls on the host. The QuickSight dashboard load might be gated by other heavy API calls on the host application. Move the logic to the web server or backend services as much as possible to limit contention on the browser.</p>\n<h4><a id=\"Dont_tear_down_the_embedding_iFrame_when_the_user_navigates_away_from_analytics_section_151\"></a><strong>Don’t tear down the embedding iFrame when the user navigates away from analytics section</strong></h4>\n<p>When the user moves temporarily to a non-analytics page of your web application (especially in single-page applications), instead of removing the embedding iframe from DOM, you can hide it from the user while keeping the iFrame in the page DOM elements. This allows you to resume the same session when the user navigates back to analytics section of your application, and they don’t need to wait for reload.</p>\n<h4><a id=\"Use_navigateToDashboard_and_navigateToSheet_whenever_possible_155\"></a><strong>Use navigateToDashboard() and navigateToSheet() whenever possible</strong></h4>\n<p>If you have multiple dashboards on your host application that don’t need to load concurrently, you can optimize the authentication flow by utilizing two APIs we expose, <code>navigateToDashboard()</code> or <code>navigateToSheet()</code>, in our JavaScript SDK. These APIs reuse the same iFrame for each load, while reusing the authentication token.</p>\n<p>This technique has proven to be very effective for many of our embedding users.</p>\n<p>For more information about these APIs, refer to <a href=\"https://www.npmjs.com/package/amazon-quicksight-embedding-sdk\" target=\"_blank\">Amazon QuickSight Embedding SDK</a>.</p>\n<h3><a id=\"Conclusion_161\"></a><strong>Conclusion</strong></h3>\n<p>In this post, we shared some tips and tricks for tuning the performance of your QuickSight dashboards. In 2021, we doubled our SPICE data limits to 500 million rows of data per dataset. In addition, incremental data refresh is available for SQL-based data sources such as <a href=\"http://aws.amazon.com/redshift\" target=\"_blank\">Amazon Redshift</a>, <a href=\"http://aws.amazon.com/athena\" target=\"_blank\">Amazon Athena</a>, <a href=\"https://aws.amazon.com/rds/\" target=\"_blank\">Amazon RDS</a>, <a href=\"https://aws.amazon.com/rds/aurora/\" target=\"_blank\">Amazon Aurora</a>, PostgreSQL, MySQL, Oracle, SQL Server, MariaDB, Presto, Teradata or Snowflake up to every 15 minutes, which cuts down time between data updates by 75%. In 2022, we continue to innovate on your behalf to make QuickSight dashboard loads even more performant.</p>\n<p>We look forward to your feedback on how these tips and tricks helped your dashboards load faster.</p>\n<h4><a id=\"About_the_Authors_166\"></a><strong>About the Authors</strong></h4>\n<p><img src=\"https://dev-media.amazoncloud.cn/6acdebd34382447b8bba8584ba67f434_image.png\" alt=\"image.png\" /></p>\n<p><strong> Shekhar Kopuri</strong> is a Senior Software Development Manager for Amazon QuickSight. He leads the front platform engineering team that focusses on various aspects of front end experience including website performance. Before joining AWS, Shekhar led development of multiple provisioning and activation network OSS applications for a large global telecommunications service provider.</p>\n<p><img src=\"https://dev-media.amazoncloud.cn/4898ead6f66b491a88ef81533241ddf9_image.png\" alt=\"image.png\" /></p>\n<p><strong>Blake Carroll</strong> is a Senior Frontend Engineer for Amazon QuickSight. He works with the frontend platform engineering team with a focus on website performance and has previously been the frontend lead for initial reporting and theming functionality in QuickSight. Prior to joining Amazon, Blake was a co-founder in the digital interactive agency space working with national brands to produce creative web experiences.</p>\n<p><img src=\"https://dev-media.amazoncloud.cn/519eaf28ed8b45909cce4e14001f1103_image.png\" alt=\"image.png\" /></p>\n<p><strong>Vijay Chaudhari</strong> is a Senior Software Development Engineer for Amazon QuickSight, AWS’ cloud-native, fully managed BI service. Vijay started his career with IBM, writing software for the Information Management group. At Amazon, he has built backend applications for retail systems, and near real-time data pre-computation, reporting and analytics systems at Amazon scale. He is passionate about learning and solving new customer problems, and helping them adopt cloud native technologies.</p>\n<p><img src=\"https://dev-media.amazoncloud.cn/f8cfe34f865c491da29547377c61796a_image.png\" alt=\"image.png\" /></p>\n<p><strong>Wakana Vilquin-Sakashita</strong> is Specialist Solution Architect for Amazon QuickSight. She works closely with customers to help making sense of the data through visualization. Previously Wakana worked for S&P Global assisting customers to access data, insights and researches relevant for their business.</p>"}
Tips and tricks for high-performant dashboards in Amazon QuickSight
海外精选

海外精选的内容汇集了全球优质的亚马逊云科技相关技术内容。同时,内容中提到的“AWS”
是 “Amazon Web Services” 的缩写,在此网站不作为商标展示。

 0
0 0
0亚马逊云科技解决方案 基于行业客户应用场景及技术领域的解决方案
联系亚马逊云科技专家
亚马逊云科技解决方案
基于行业客户应用场景及技术领域的解决方案
联系专家

0
目录

 分享
分享 点赞
点赞 收藏
收藏 目录
目录立即注册,开启您的免费套餐
立即关注

亚马逊云开发者
公众号

User Group
公众号

亚马逊云科技
官方小程序
“AWS” 是 “Amazon Web Services” 的缩写,在此网站不作为商标展示。
立即关注
亚马逊云开发者
公众号
User Group
公众号
亚马逊云科技
官方小程序
“AWS” 是 “Amazon Web Services” 的缩写,在此网站不作为商标展示。
关于我们 
更多资源
开发者工具
更多支持
立即关注
亚马逊云开发者
公众号
User Group
公众号
亚马逊云科技
官方小程序
“AWS” 是 “Amazon Web Services” 的缩写,在此网站不作为商标展示。
