{"value":"A machine learning training job can seem to be running like a charm, while it’s really suffering from problems such as overfitting, exploding model parameters, and vanishing gradients, which can compromise model performance. Historically, spotting such problems during training has required the persistent attention of a machine learning expert.\n\nThe Amazon SageMaker team has developed a new tool, [SageMaker Debugger](https://aws.amazon.com/sagemaker/debugger/), that automates this problem-spotting process, saving customers time and money. For example, by using Debugger, one SageMaker customer reduced model size by 45% and the number of GPU operations by 33%, while improving accuracy.\n\nNext week, at the Conference on Machine Learning and Systems ([MLSys](https://www.amazon.science/conferences-and-events/mlsys-2021)), we will present a [paper](https://www.amazon.science/publications/amazon-sagemaker-debugger-a-system-for-real-time-insights-into-machine-learning-model-training) that describes the technology behind SageMaker Debugger. \n\n#### **Output tensors and rules**\n\nWhen debugging a neural network model, Debugger collects output tensors to capture the model’s various states throughout training. A tensor is a higher-dimensional analogue of a matrix, and by default, Debugger’s output tensors can include values such as loss, or how far short of its target the model output falls; the outputs of each layer; the weights on the connections between layers; and, when the model is being updated during optimization, the weight gradients, or the direction in which the weights should be tuned to minimize loss. Customers can also design their own customized output tensors.\n\n\n\nA visualization of activation output tensors captured by SageMaker Debugger for a deep-learning model trained on the MNIST dataset of handwritten digits.\n\nDebugger automatically applies a set of rules to the output tensors to ensure that the model is learning. The rules monitor things like changes in the absolute size of individual weights, the relative size of the gradients across layers, and the number of individual network nodes — or neurons — with zero outputs. And again, customers can add their own rules as well.\n\nDebugger also provides rules for [decision tree](https://www.amazon.science/tag/gradient-boosted-decision-trees) models built using [XGBoost](https://docs.aws.amazon.com/sagemaker/latest/dg/xgboost.html). For example, Debugger can check the depth of individual trees in an ensemble; with larger tree depth, the model is prone to overfitting, or failing to generalize to data outside the training set.\n\n#### **Debugger architecture**\n\nThe diagram at right shows the Debugger workflow on Amazon SageMaker. Debugger captures output tensors from a training job in progress and uploads them to an Amazon S3 storage bucket. Debugger rules run on a separate instance, or allotment of computing capacity in the cloud, so the analysis does not interfere with the training. This helps ensure Debugger’s scalability.\n\nBy default, Debugger can perform certain actions when it finds problems, such as notifications via text or e-mail or the interruption of training jobs. Users can also play with CloudWatch events and Lambda functions to create their own automated actions.\n\n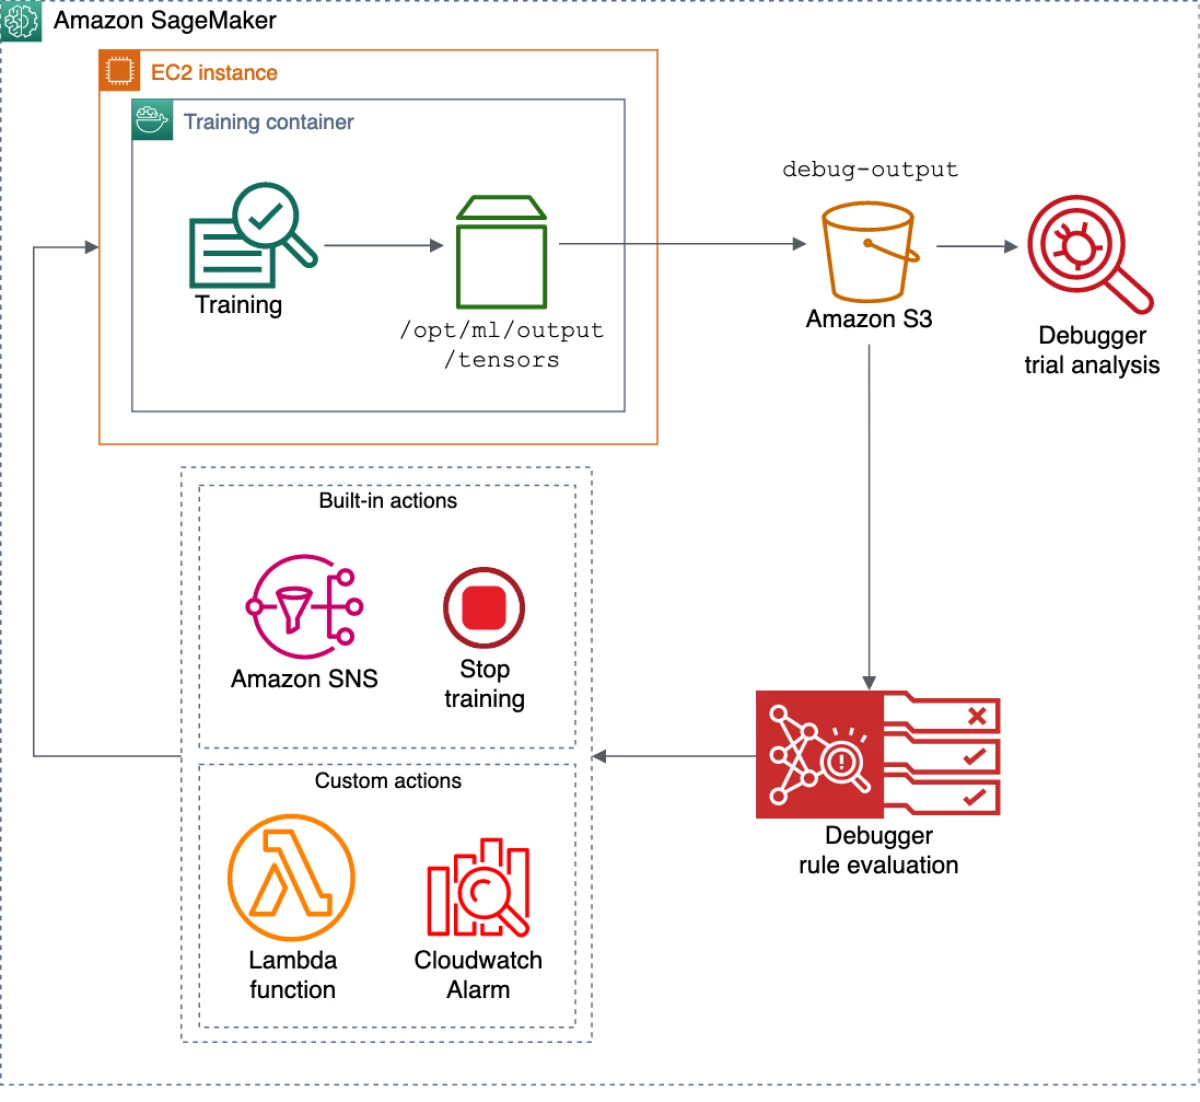\n\nThe architecture diagram of Debugger, as applied to an Amazon SageMaker training workflow.\n\n#### **Bug spotting**\n\nProblems can arise at any point in the machine learning lifecycle, but some of the most common are data imbalances, bad initialization, vanishing/exploding gradients (including neuron saturation and dead ReLUs), and overfitting. Debugger’s built-in rules check for all of those problems — and more.\n\n#### **Data imbalances**\n\nDuring data preparation, we need to ensure that the data is correctly preprocessed and normalized and that it contains representative samples. If the data contains too many correlated features or is not normalized, the model is likely to overfit. \n\nTargeted rule: Debugger checks for balance between the different classes of data in the training set. It can also verify whether data has been correctly normalized by checking for zero mean and unit variance.\n\n#### **Bad initialization**\n\nInitialization assigns random values to model parameters. If all parameters have the same initial value, they receive the same gradient, and the model is unable to learn. Initializing parameters with values that are too small or too large may lead to vanishing or exploding gradients.\n\nTargeted rule: At the start of model training, Debugger checks that weights connected to the same neuron do not have the same initial values. Debugger also checks that the variance of the weights per layer does not exceed a threshold.\n\n#### **Vanishing/exploding gradients**\n\nDeep neural networks typically learn through back-propagation, in which the model’s loss is traced back through the network. Neurons’ weights are modified in order to minimize loss. If the network is too deep, however, the learning algorithm can spend its whole loss budget on the top layers, and weights in the lower layers never get updated. That’s the vanishing-gradient problem.\n\nConversely, the learning algorithm might trace a series of errors to the same neuron, resulting in such a large modification to that neuron’s weight that it imbalances the network. That’s the exploding-gradient problem.\n\nTargeted rule: Debugger monitors statistical properties of the gradients and raises an alarm if they cross a predefined threshold.\n\n#### **Neuron saturation/dead ReLUs**\n\nOne of the most common causes of vanishing gradients is neuron saturation. Each neuron in a neural network has an activation function, which determines whether it “fires” — produces an output — in response to particular inputs. Some activation functions, such as sigmoid and tanh, can lead to neuron saturation, in which large changes in inputs produce small changes in outputs. The weights of saturated neurons are, essentially, impossible to update.\n\nTo prevent neuron saturation, many state-of-the-art models use the ReLU activation function. The output of the ReLU function increases linearly with inputs above some threshold but is zero otherwise. Such models instead run the risk of the dying-ReLU problem: the gradients vanish because the activation outputs go zero.\n\nTargeted rule: To identify neuron saturation, Debugger checks the activation outputs; to identify dead ReLUs, it counts how many neurons in a model output zero values.\n\n#### **Overfitting**\n\nThe training loop consists of training and validation. If the model’s performance improves on a training set but not on a validation set, it’s a clear indication of overfitting. If the model’s performance initially improves on the validation set but then begins to fall off, training needs to be stopped to prevent overfitting.\n\nTargeted rule: Debugger checks whether the ratio between validation loss and training loss exceeds a threshold.\n\nThese are just some of the rules built into Debugger; the full list is in the table below. \n\n\n\nCustomers can also use Debugger’s API to get real-time insights into their models, [plotting weight distributions](https://sagemaker-examples.readthedocs.io/en/latest/sagemaker-debugger/mnist_tensor_analysis/mnist_tensor_analysis.html), [visualizing the low-dimensional latent space](https://docs.aws.amazon.com/sagemaker/latest/dg/debugger-visualization.html#debugger-visualization-autoencoder_mnist) of [t-SNE](https://en.wikipedia.org/wiki/T-distributed_stochastic_neighbor_embedding) (as in the animation above), [creating saliency maps](https://aws.amazon.com/blogs/machine-learning/detecting-and-analyzing-incorrect-model-predictions-with-amazon-sagemaker-model-monitor-and-debugger/), and the like.\n\nTo get started with Debugger, check out our [GitHub repo](https://github.com/awslabs/sagemaker-debugger) and install the smdebug library from [PyPI](https://pypi.org/project/smdebug/). We have a [rich list of examples](https://sagemaker-examples.readthedocs.io/en/latest/sagemaker-debugger/index.html) that show the usage of Debugger for beginner, intermediate, and advanced use cases. For further details on Debugger, check out the [MLSys Debugger paper](https://www.amazon.science/publications/amazon-sagemaker-debugger-a-system-for-real-time-insights-into-machine-learning-model-training) and the S[ageMaker Debugger developer guide](https://docs.aws.amazon.com/sagemaker/latest/dg/train-debugger.html).\n\nABOUT THE AUTHOR\n\n#### **[Nathalie Rauschmayr](https://www.amazon.science/author/nathalie-rauschmayr)**\n\nNathalie Rauschmayr is an applied scientist with Amazon Web Services.\n\n#### **Krishnaram Kenthapadi**\n\nKrishnaram Kenthapadi is a principal scientist with Amazon Web Services.\n\n#### **[Miyoung Choi](https://www.amazon.science/author/miyoung-choi)**\n\nMiyoung Choi is a programmer writer with Amazon Web Services.","render":"<p>A machine learning training job can seem to be running like a charm, while it’s really suffering from problems such as overfitting, exploding model parameters, and vanishing gradients, which can compromise model performance. Historically, spotting such problems during training has required the persistent attention of a machine learning expert.</p>\n<p>The Amazon SageMaker team has developed a new tool, <a href=\"https://aws.amazon.com/sagemaker/debugger/\" target=\"_blank\">SageMaker Debugger</a>, that automates this problem-spotting process, saving customers time and money. For example, by using Debugger, one SageMaker customer reduced model size by 45% and the number of GPU operations by 33%, while improving accuracy.</p>\n<p>Next week, at the Conference on Machine Learning and Systems (<a href=\"https://www.amazon.science/conferences-and-events/mlsys-2021\" target=\"_blank\">MLSys</a>), we will present a <a href=\"https://www.amazon.science/publications/amazon-sagemaker-debugger-a-system-for-real-time-insights-into-machine-learning-model-training\" target=\"_blank\">paper</a> that describes the technology behind SageMaker Debugger.</p>\n<h4><a id=\"Output_tensors_and_rules_6\"></a><strong>Output tensors and rules</strong></h4>\n<p>When debugging a neural network model, Debugger collects output tensors to capture the model’s various states throughout training. A tensor is a higher-dimensional analogue of a matrix, and by default, Debugger’s output tensors can include values such as loss, or how far short of its target the model output falls; the outputs of each layer; the weights on the connections between layers; and, when the model is being updated during optimization, the weight gradients, or the direction in which the weights should be tuned to minimize loss. Customers can also design their own customized output tensors.</p>\n<p><img src=\"https://dev-media.amazoncloud.cn/2389412d02c24c3b92b8a11635f8bf59_image.png\" alt=\"image.png\" /></p>\n<p>A visualization of activation output tensors captured by SageMaker Debugger for a deep-learning model trained on the MNIST dataset of handwritten digits.</p>\n<p>Debugger automatically applies a set of rules to the output tensors to ensure that the model is learning. The rules monitor things like changes in the absolute size of individual weights, the relative size of the gradients across layers, and the number of individual network nodes — or neurons — with zero outputs. And again, customers can add their own rules as well.</p>\n<p>Debugger also provides rules for <a href=\"https://www.amazon.science/tag/gradient-boosted-decision-trees\" target=\"_blank\">decision tree</a> models built using <a href=\"https://docs.aws.amazon.com/sagemaker/latest/dg/xgboost.html\" target=\"_blank\">XGBoost</a>. For example, Debugger can check the depth of individual trees in an ensemble; with larger tree depth, the model is prone to overfitting, or failing to generalize to data outside the training set.</p>\n<h4><a id=\"Debugger_architecture_18\"></a><strong>Debugger architecture</strong></h4>\n<p>The diagram at right shows the Debugger workflow on Amazon SageMaker. Debugger captures output tensors from a training job in progress and uploads them to an Amazon S3 storage bucket. Debugger rules run on a separate instance, or allotment of computing capacity in the cloud, so the analysis does not interfere with the training. This helps ensure Debugger’s scalability.</p>\n<p>By default, Debugger can perform certain actions when it finds problems, such as notifications via text or e-mail or the interruption of training jobs. Users can also play with CloudWatch events and Lambda functions to create their own automated actions.</p>\n<p><img src=\"https://dev-media.amazoncloud.cn/9db7105c50ad4f0a9d10ed1a95092904_image.png\" alt=\"image.png\" /></p>\n<p>The architecture diagram of Debugger, as applied to an Amazon SageMaker training workflow.</p>\n<h4><a id=\"Bug_spotting_28\"></a><strong>Bug spotting</strong></h4>\n<p>Problems can arise at any point in the machine learning lifecycle, but some of the most common are data imbalances, bad initialization, vanishing/exploding gradients (including neuron saturation and dead ReLUs), and overfitting. Debugger’s built-in rules check for all of those problems — and more.</p>\n<h4><a id=\"Data_imbalances_32\"></a><strong>Data imbalances</strong></h4>\n<p>During data preparation, we need to ensure that the data is correctly preprocessed and normalized and that it contains representative samples. If the data contains too many correlated features or is not normalized, the model is likely to overfit.</p>\n<p>Targeted rule: Debugger checks for balance between the different classes of data in the training set. It can also verify whether data has been correctly normalized by checking for zero mean and unit variance.</p>\n<h4><a id=\"Bad_initialization_38\"></a><strong>Bad initialization</strong></h4>\n<p>Initialization assigns random values to model parameters. If all parameters have the same initial value, they receive the same gradient, and the model is unable to learn. Initializing parameters with values that are too small or too large may lead to vanishing or exploding gradients.</p>\n<p>Targeted rule: At the start of model training, Debugger checks that weights connected to the same neuron do not have the same initial values. Debugger also checks that the variance of the weights per layer does not exceed a threshold.</p>\n<h4><a id=\"Vanishingexploding_gradients_44\"></a><strong>Vanishing/exploding gradients</strong></h4>\n<p>Deep neural networks typically learn through back-propagation, in which the model’s loss is traced back through the network. Neurons’ weights are modified in order to minimize loss. If the network is too deep, however, the learning algorithm can spend its whole loss budget on the top layers, and weights in the lower layers never get updated. That’s the vanishing-gradient problem.</p>\n<p>Conversely, the learning algorithm might trace a series of errors to the same neuron, resulting in such a large modification to that neuron’s weight that it imbalances the network. That’s the exploding-gradient problem.</p>\n<p>Targeted rule: Debugger monitors statistical properties of the gradients and raises an alarm if they cross a predefined threshold.</p>\n<h4><a id=\"Neuron_saturationdead_ReLUs_52\"></a><strong>Neuron saturation/dead ReLUs</strong></h4>\n<p>One of the most common causes of vanishing gradients is neuron saturation. Each neuron in a neural network has an activation function, which determines whether it “fires” — produces an output — in response to particular inputs. Some activation functions, such as sigmoid and tanh, can lead to neuron saturation, in which large changes in inputs produce small changes in outputs. The weights of saturated neurons are, essentially, impossible to update.</p>\n<p>To prevent neuron saturation, many state-of-the-art models use the ReLU activation function. The output of the ReLU function increases linearly with inputs above some threshold but is zero otherwise. Such models instead run the risk of the dying-ReLU problem: the gradients vanish because the activation outputs go zero.</p>\n<p>Targeted rule: To identify neuron saturation, Debugger checks the activation outputs; to identify dead ReLUs, it counts how many neurons in a model output zero values.</p>\n<h4><a id=\"Overfitting_60\"></a><strong>Overfitting</strong></h4>\n<p>The training loop consists of training and validation. If the model’s performance improves on a training set but not on a validation set, it’s a clear indication of overfitting. If the model’s performance initially improves on the validation set but then begins to fall off, training needs to be stopped to prevent overfitting.</p>\n<p>Targeted rule: Debugger checks whether the ratio between validation loss and training loss exceeds a threshold.</p>\n<p>These are just some of the rules built into Debugger; the full list is in the table below.</p>\n<p><img src=\"https://dev-media.amazoncloud.cn/9b9b77d6f57d488a914bd976bf9007c9_image.png\" alt=\"image.png\" /></p>\n<p>Customers can also use Debugger’s API to get real-time insights into their models, <a href=\"https://sagemaker-examples.readthedocs.io/en/latest/sagemaker-debugger/mnist_tensor_analysis/mnist_tensor_analysis.html\" target=\"_blank\">plotting weight distributions</a>, <a href=\"https://docs.aws.amazon.com/sagemaker/latest/dg/debugger-visualization.html#debugger-visualization-autoencoder_mnist\" target=\"_blank\">visualizing the low-dimensional latent space</a> of <a href=\"https://en.wikipedia.org/wiki/T-distributed_stochastic_neighbor_embedding\" target=\"_blank\">t-SNE</a> (as in the animation above), <a href=\"https://aws.amazon.com/blogs/machine-learning/detecting-and-analyzing-incorrect-model-predictions-with-amazon-sagemaker-model-monitor-and-debugger/\" target=\"_blank\">creating saliency maps</a>, and the like.</p>\n<p>To get started with Debugger, check out our <a href=\"https://github.com/awslabs/sagemaker-debugger\" target=\"_blank\">GitHub repo</a> and install the smdebug library from <a href=\"https://pypi.org/project/smdebug/\" target=\"_blank\">PyPI</a>. We have a <a href=\"https://sagemaker-examples.readthedocs.io/en/latest/sagemaker-debugger/index.html\" target=\"_blank\">rich list of examples</a> that show the usage of Debugger for beginner, intermediate, and advanced use cases. For further details on Debugger, check out the <a href=\"https://www.amazon.science/publications/amazon-sagemaker-debugger-a-system-for-real-time-insights-into-machine-learning-model-training\" target=\"_blank\">MLSys Debugger paper</a> and the S<a href=\"https://docs.aws.amazon.com/sagemaker/latest/dg/train-debugger.html\" target=\"_blank\">ageMaker Debugger developer guide</a>.</p>\n<p>ABOUT THE AUTHOR</p>\n<h4><a id=\"Nathalie_Rauschmayrhttpswwwamazonscienceauthornathalierauschmayr_76\"></a><strong><a href=\"https://www.amazon.science/author/nathalie-rauschmayr\" target=\"_blank\">Nathalie Rauschmayr</a></strong></h4>\n<p>Nathalie Rauschmayr is an applied scientist with Amazon Web Services.</p>\n<h4><a id=\"Krishnaram_Kenthapadi_80\"></a><strong>Krishnaram Kenthapadi</strong></h4>\n<p>Krishnaram Kenthapadi is a principal scientist with Amazon Web Services.</p>\n<h4><a id=\"Miyoung_Choihttpswwwamazonscienceauthormiyoungchoi_84\"></a><strong><a href=\"https://www.amazon.science/author/miyoung-choi\" target=\"_blank\">Miyoung Choi</a></strong></h4>\n<p>Miyoung Choi is a programmer writer with Amazon Web Services.</p>\n"}
The science behind SageMaker’s cost-saving Debugger
海外精选

海外精选的内容汇集了全球优质的亚马逊云科技相关技术内容。同时,内容中提到的“AWS”
是 “Amazon Web Services” 的缩写,在此网站不作为商标展示。

 0
0 0
0亚马逊云科技解决方案 基于行业客户应用场景及技术领域的解决方案
联系亚马逊云科技专家
亚马逊云科技解决方案
基于行业客户应用场景及技术领域的解决方案
联系专家

0
目录

 分享
分享 点赞
点赞 收藏
收藏 目录
目录立即注册,开启您的免费套餐
立即关注

亚马逊云开发者
公众号

User Group
公众号

亚马逊云科技
官方小程序
“AWS” 是 “Amazon Web Services” 的缩写,在此网站不作为商标展示。
立即关注
亚马逊云开发者
公众号
User Group
公众号
亚马逊云科技
官方小程序
“AWS” 是 “Amazon Web Services” 的缩写,在此网站不作为商标展示。
关于我们 
更多资源
开发者工具
更多支持
立即关注
亚马逊云开发者
公众号
User Group
公众号
亚马逊云科技
官方小程序
“AWS” 是 “Amazon Web Services” 的缩写,在此网站不作为商标展示。
