{"value":"[Amazon QuickSight](https://aws.amazon.com/cn/quicksight/) is a cloud-scale business intelligence (BI) service that you can use to deliver easy-to-understand insights to the people you work with, wherever they are.\n\nYou can build dashboards using combinations of data in the cloud, on premises, in other software as a service (SaaS) apps, and in flat files. Although users can always view and interact with dashboards on-demand in their browser or our native mobile apps, sometimes users prefer to receive notifications and report snapshots on a scheduled basis or when a certain value surpasses a user-defined threshold.\n\nIn this post, we walk you through the features and process of scheduling email reports and configuring threshold-based alerts.\n\n\n#### **Overview of solution**\n\n\nIn QuickSight Enterprise edition, you can email a report from each dashboard on a scheduled basis or based on a threshold set for KPI and gauge visuals. Scheduled reports include settings for when to send them, the contents to include, and who receives the email.\n\nScheduled email reports work with row-level security so that each user receives reports containing only data that is relevant to them. Alert reports include threshold value, alert condition, and the receiver’s email. To set up or change the report sent from a dashboard, make sure that you’re an owner or co-owner of the dashboard.\n\nTo receive email reports, the users or group members must be part of your QuickSight account. They must have completed the sign-up process to activate their subscription as QuickSight readers, authors, or admins.\n\nIn this post, we configure the email settings for a QuickSight dashboard for users and construct a custom email for each user or group based on their data permissions.\n\nThe solution includes the following high-level steps:\n\n1. Set up scheduled email alerts for your existing reports.\n2. Set up threshold-based email alerts for the existing reports.\n3. View alert history.\n4. Set up email alerts if the dataset refresh fails.\n\n\n#### **Prerequisites**\n\n\nFor this walkthrough, you should have the following prerequisites:\n\n- An [Amazon Web Services account](https://signin.aws.amazon.com/signin?redirect_uri=https%3A%2F%2Fportal.aws.amazon.com%2Fbilling%2Fsignup%2Fresume&client_id=signup)\n- QuickSight Enterprise edition\n- Existing QuickSight reports with appropriate data permissions and dynamic defaults that are set on dashboards that will be honored in email reports. Each reader will receive emails and PDFs of dashboards personalized to them. To learn more about dynamic defaults, refer to [Creating parameter defaults in Amazon QuickSight](https://docs.aws.amazon.com/quicksight/latest/user/parameters-default-values.html). You can follow the instructions in [Applying row-level and column-level security on Amazon QuickSight dashboards](https://aws.amazon.com/cn/blogs/big-data/applying-row-level-and-column-level-security-on-amazon-quicksight-dashboards/) to develop the reports and define permissions.\n\n\n#### **Set up scheduled email alerts**\n\n\nTo configure scheduled emails for your reports, complete the following steps:\n\n1. On the QuickSight console, choose **Dashboard** in the navigation pane.\n2. Open a dashboard.\n3. On the **Share** menu, choose **Email report**.\n\n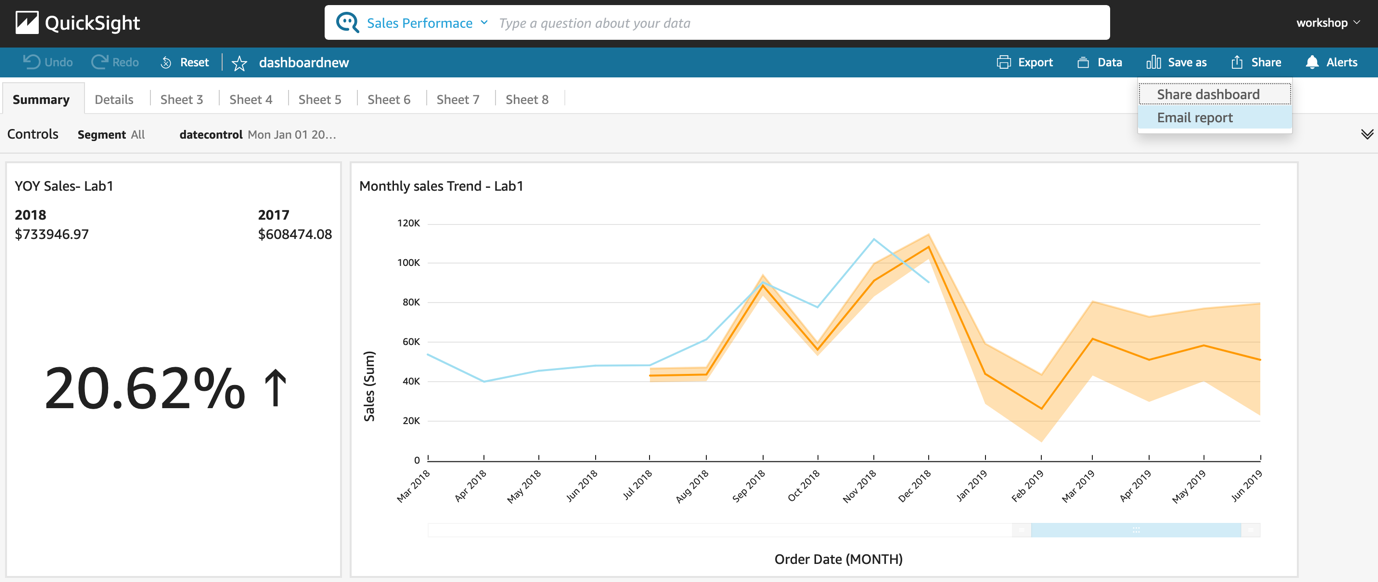\n\n4. For **Schedule**, choose the frequency for the report. For this post, we choose **Repeat once a week**.\n\n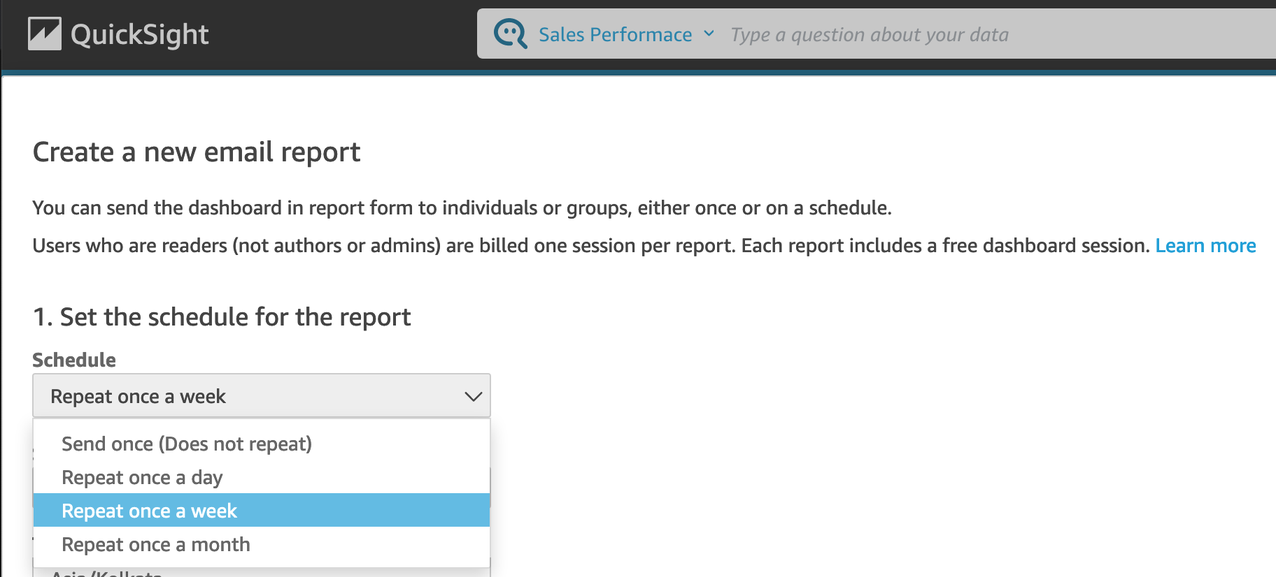\n\n5. For **Send first report on**, choose a date and time.\n6. For **Time zone**, choose the time zone.\n7. For **Report title**, enter a custom title for the report.\n8. For **(Optional) E-mail subject line**, leave it blank to use the report title or enter a custom subject line.\n9. For **(Optional) E-mail body text**, leave it blank or enter a custom message to display at the beginning of the email.\n\n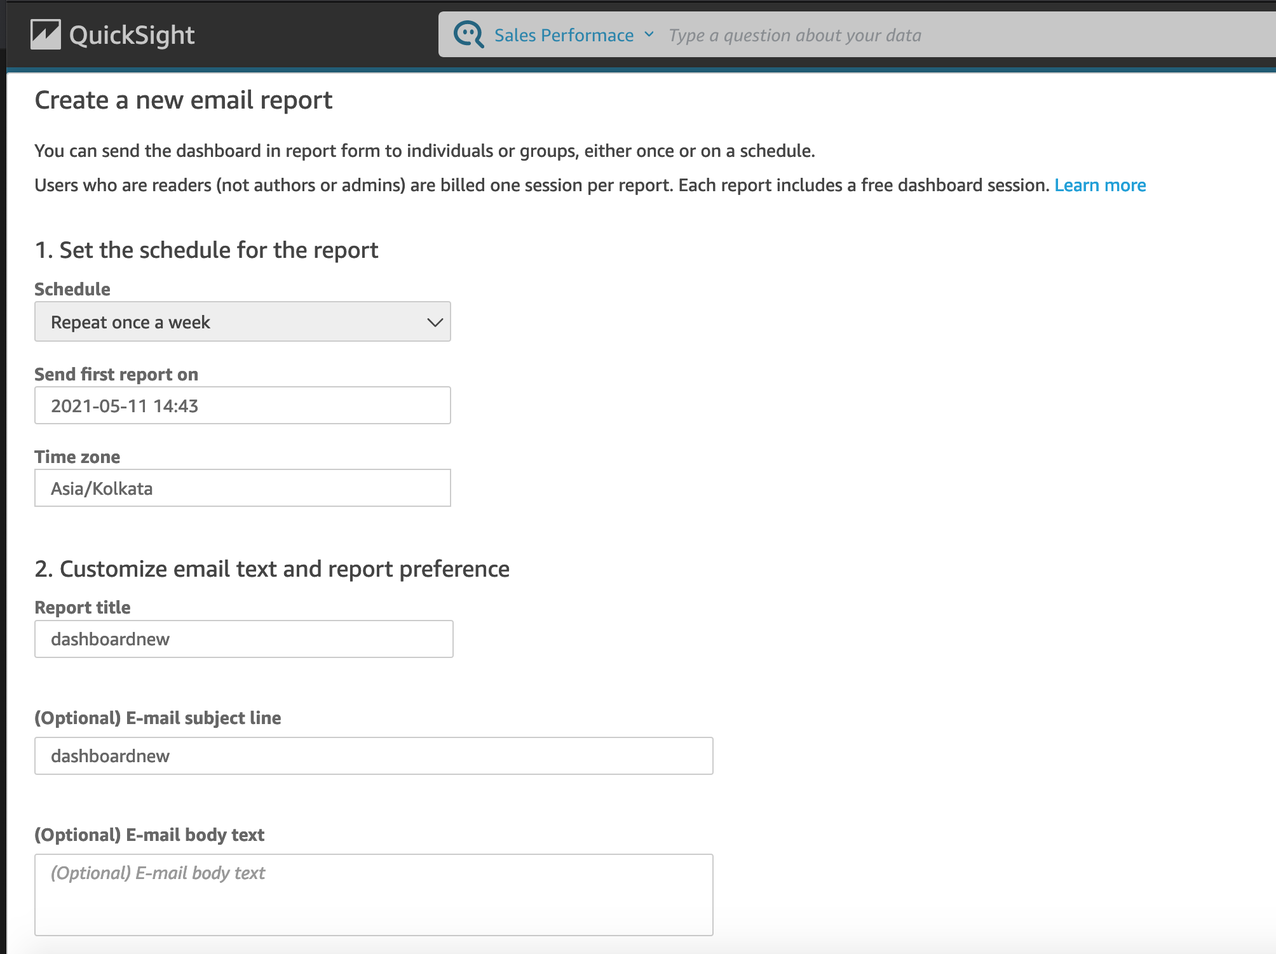\n\n10. Select **Include PDF attachment** to attach a PDF snapshot of the items visible on the first sheet of the dashboard.\n11. For **Optimize report for**, choose a default layout option for new users.\n12. Under **Recipients**, select specific recipients from the list (recommended), or select **Send email report to all users with access to dashboard**.\n13. To send a sample of the report before you save changes, choose **Send test report**.\n\nThis option is displayed next to the user name of the dashboard owner.\n\n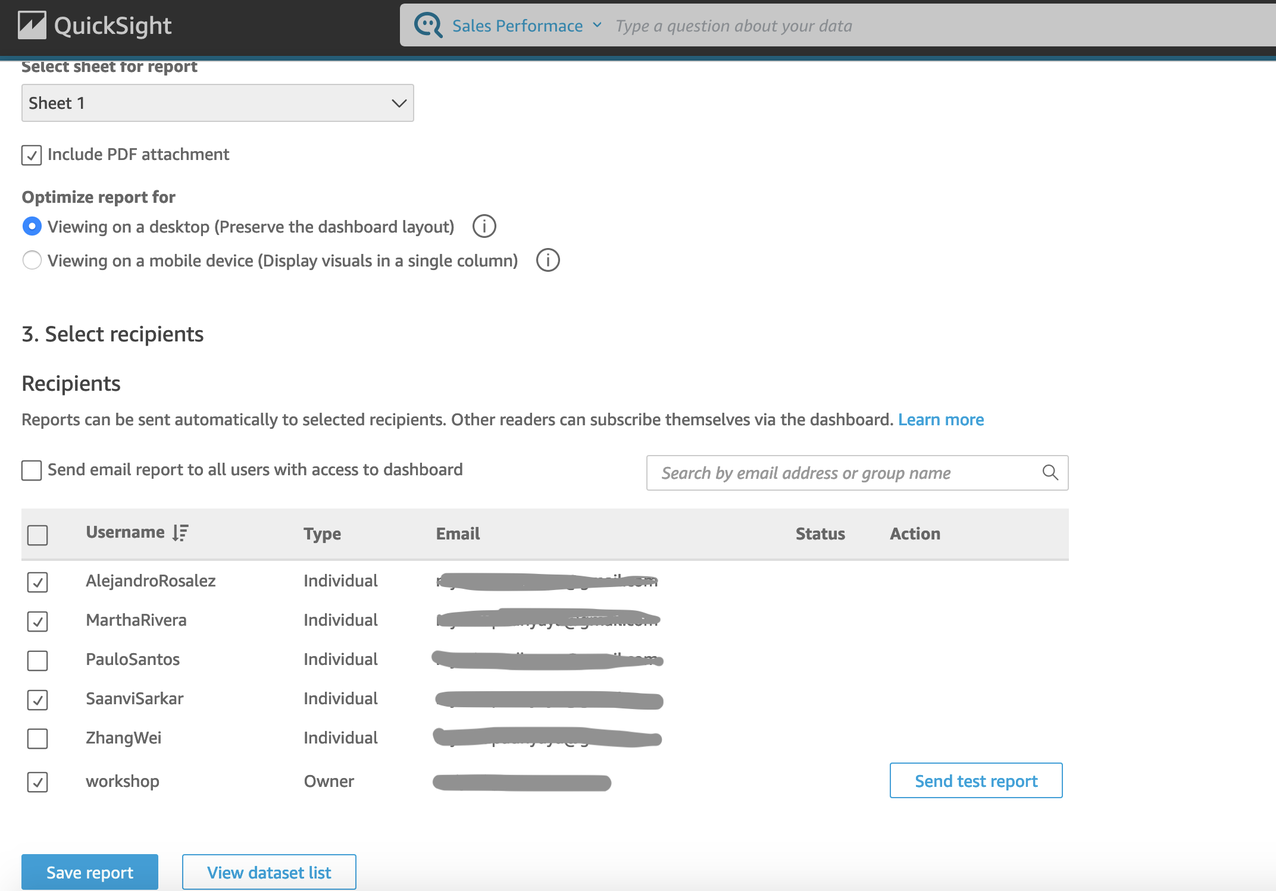\n\n14. To view a list of the datasets used by this report, choose **View dataset list**.\n\n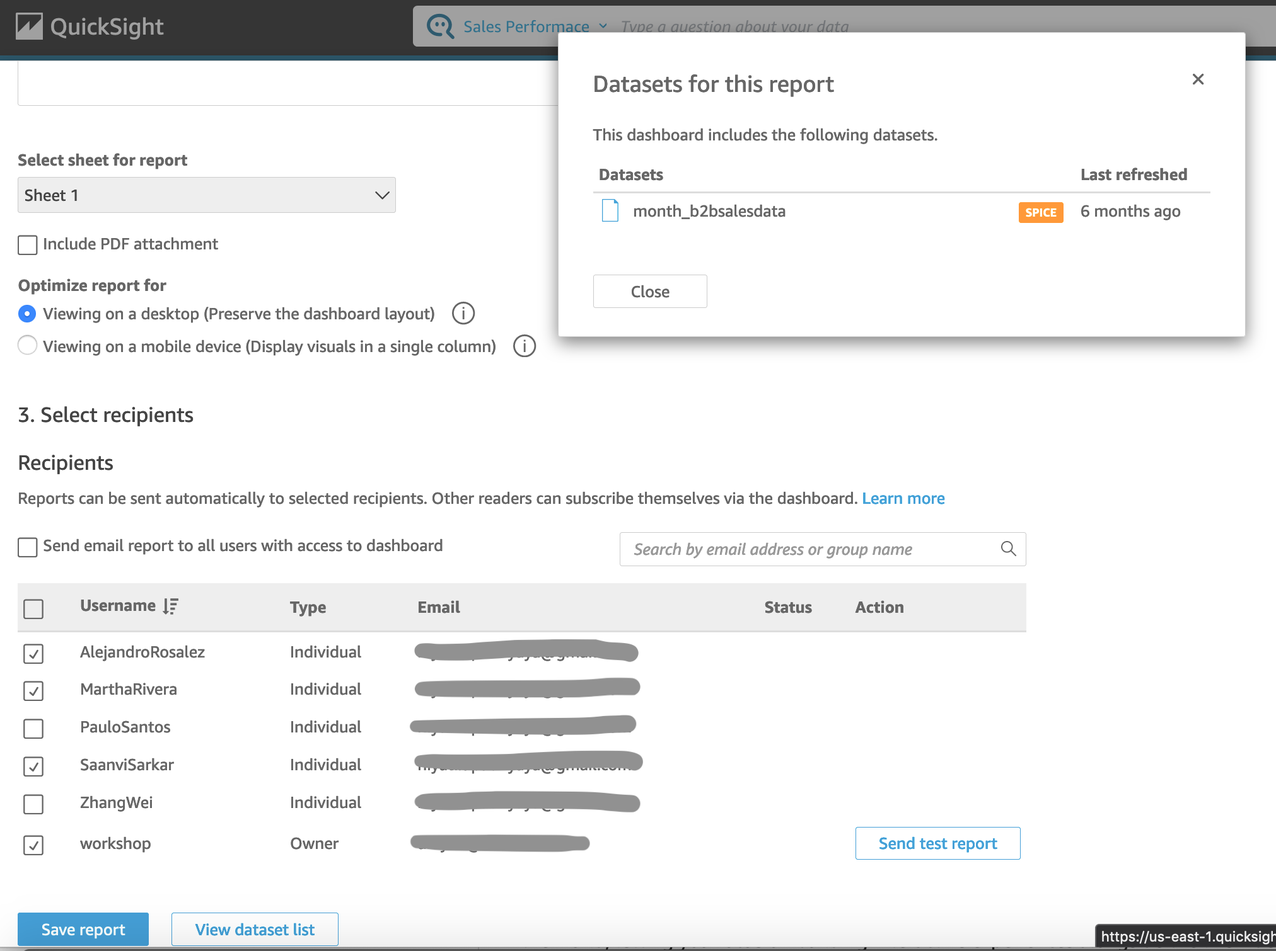\n\n15. Choose **Save report** or **Update report**.\n\nA “Report scheduled” message briefly appears to confirm your entries.\n\n16. To immediately send a report, choose **Update & send a report now**.\n\nThe report is sent immediately, even if your schedule’s start date is in the future.\n\n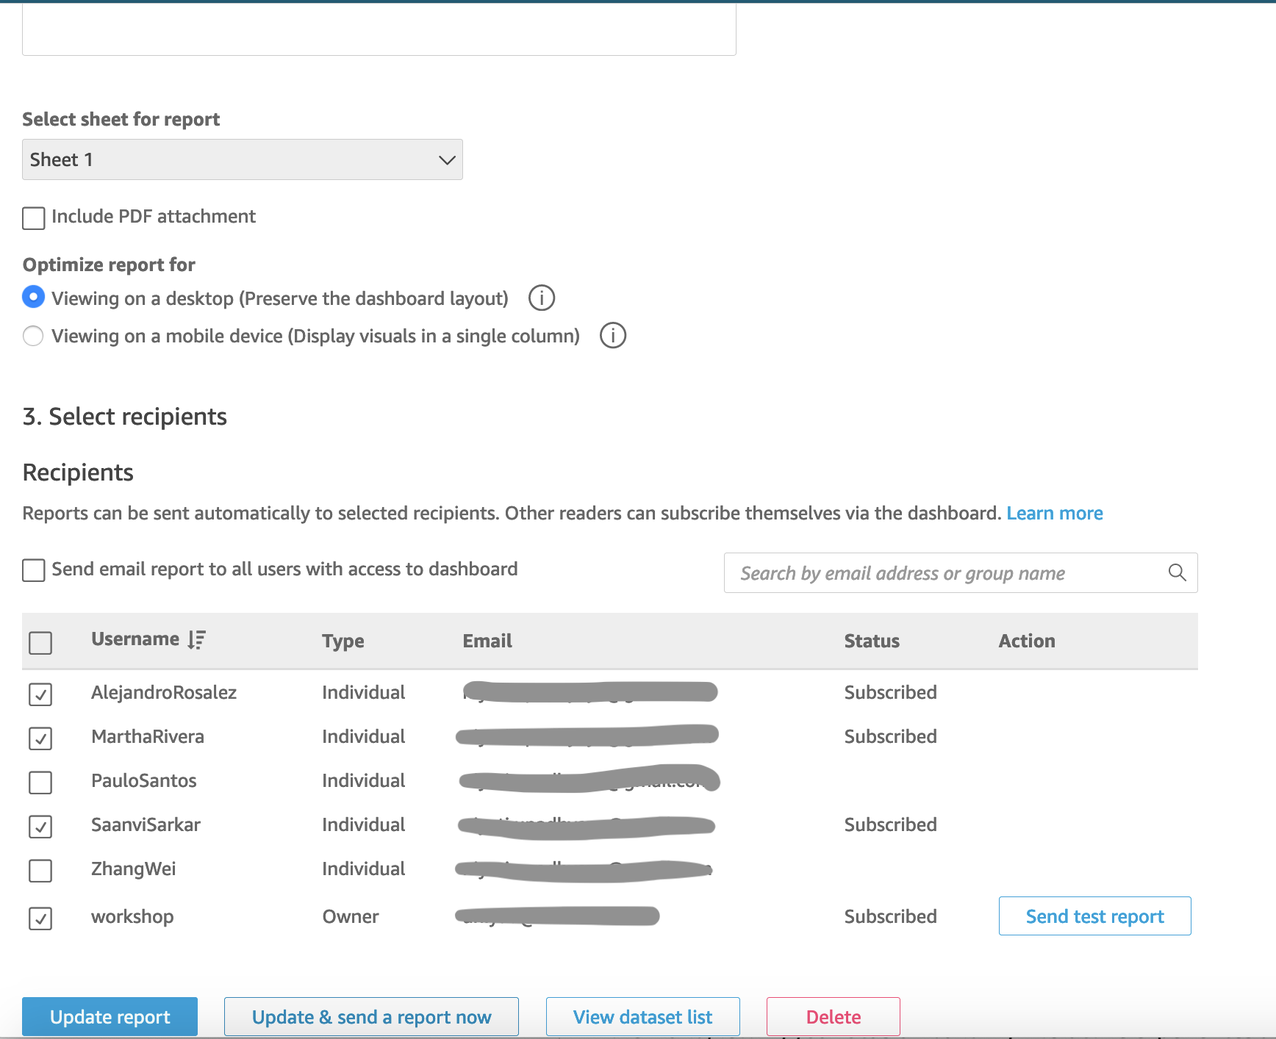 \n\nThe following screenshot shows the PDF report visible to the user ```AlejandroRosalez```. They have access to data where the state is California or Texas, and the city is Los Angeles or Fort Worth.\n\n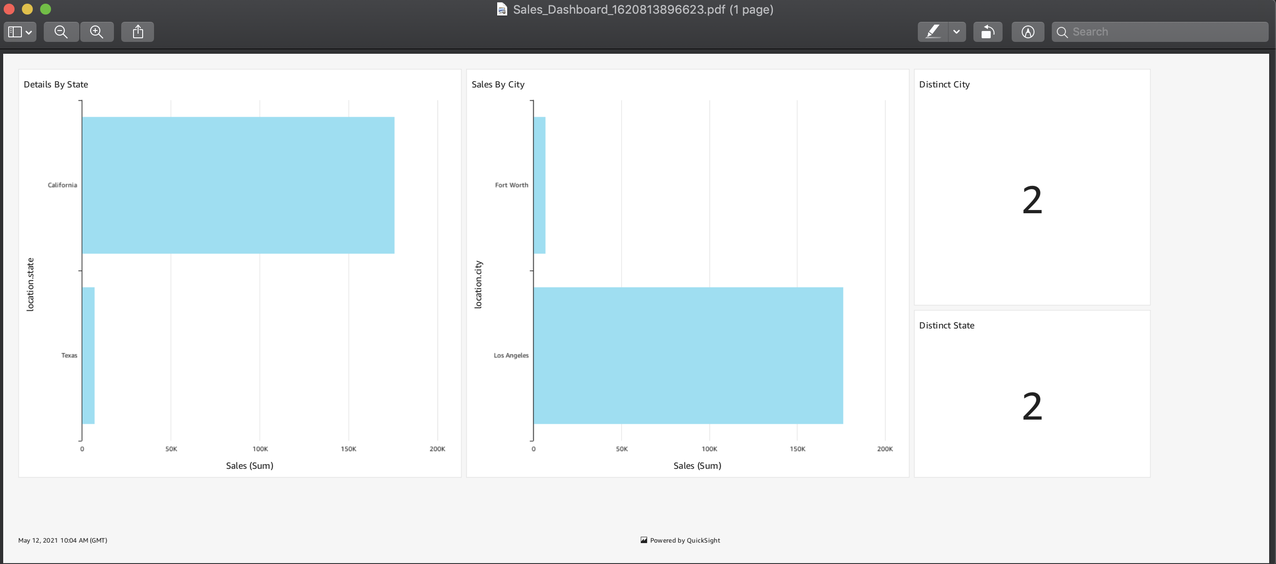\n\nThe following screenshot shows the report visible to the user ```SaanviSarkar```. They can see data for any city, but only if the state is Texas.\n\n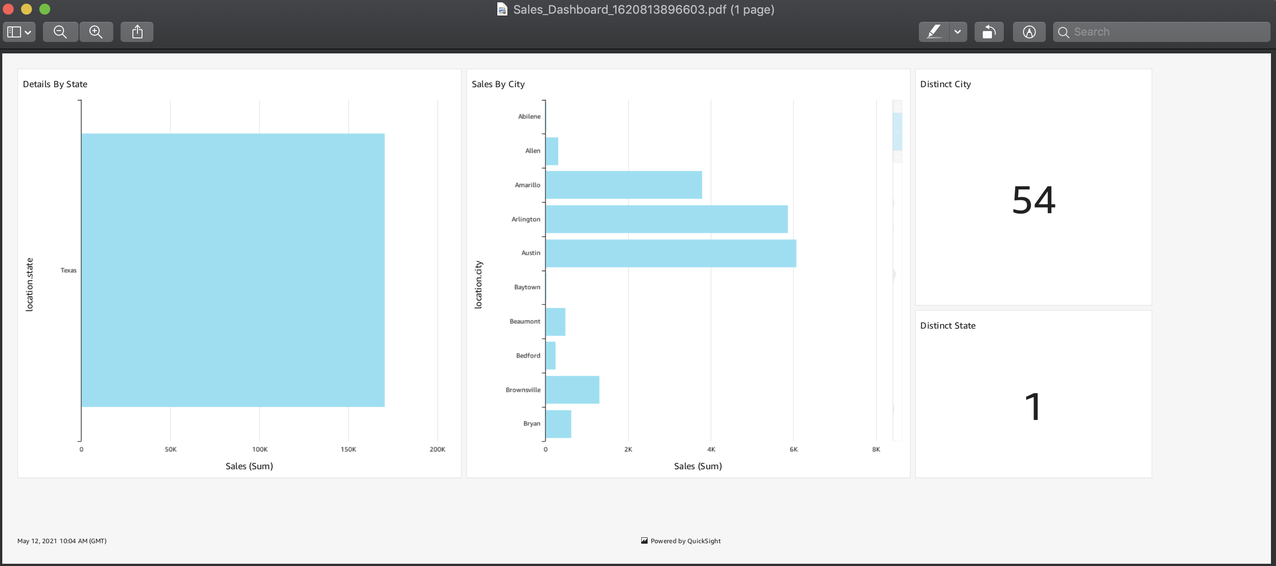\n\nThe following screenshot shows the report visible to the user ```MarthaRivera```. Martha can see the data for any city or state.\n\n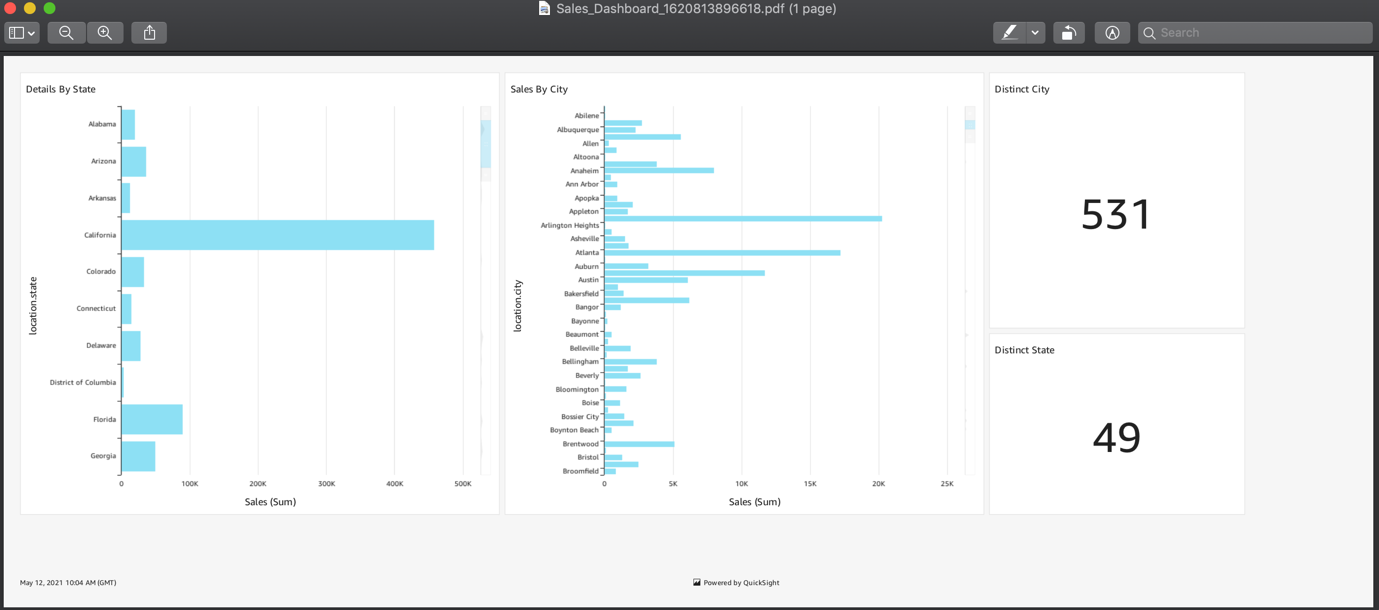\n\nThe following screenshot shows that no data is visible to the ```workshop``` user, which isn’t present in the ```permissions.csv``` file.\n\n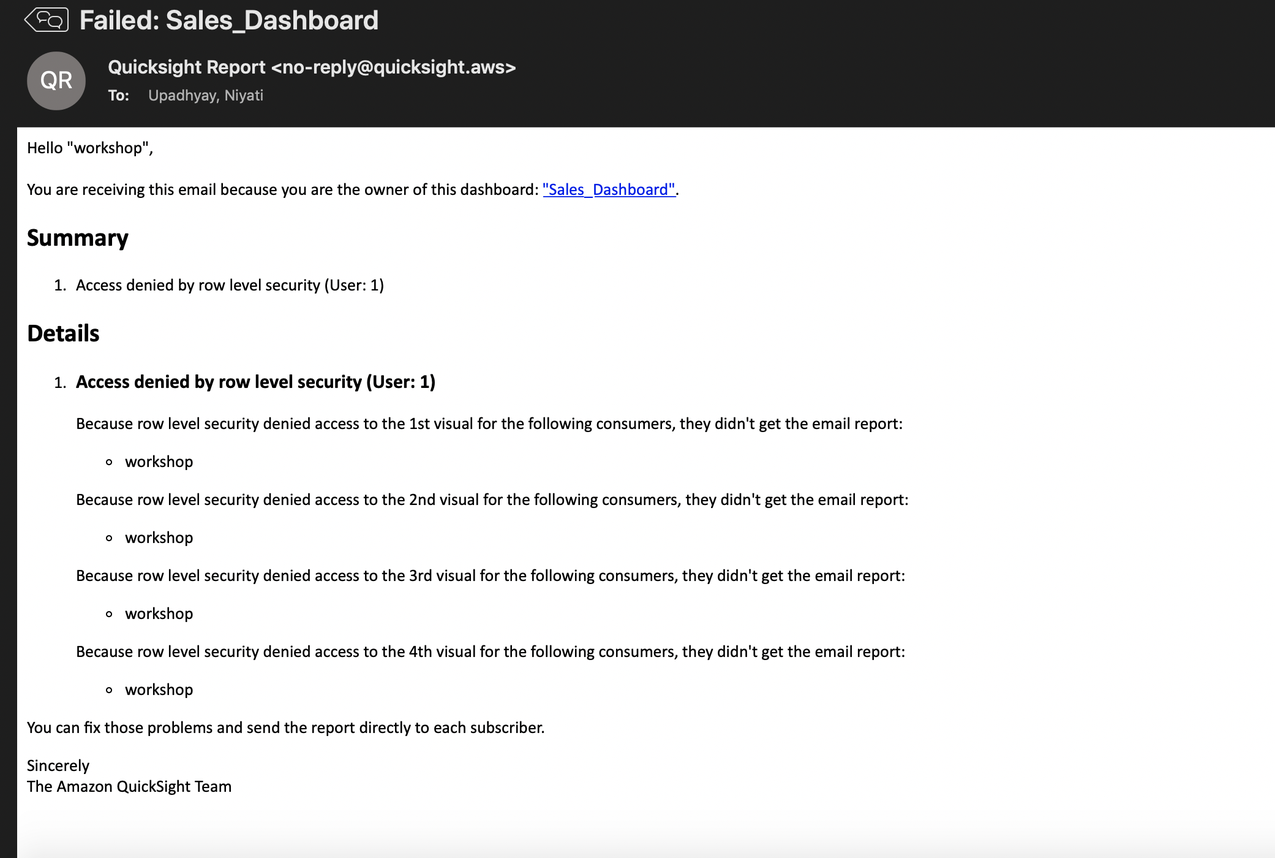\n\n\n#### **Set up threshold-based email alerts**\n\n\nTo create an alert based on a threshold, complete the following steps:\n\n1. On the QuickSight dashboard, choose **Dashboards**, and navigate to the dashboard that you want.\n\nFor more information about viewing dashboards as a dashboard subscriber in QuickSight, see [Exploring Dashboards](https://docs.aws.amazon.com/quicksight/latest/user/exploring-dashboards.html).\n\n2. In the dashboard, select the KPI or gauge visual that you want to create an alert for.\n3. On the options menu at upper-right on the visual, choose the **Create alert** icon.\n\n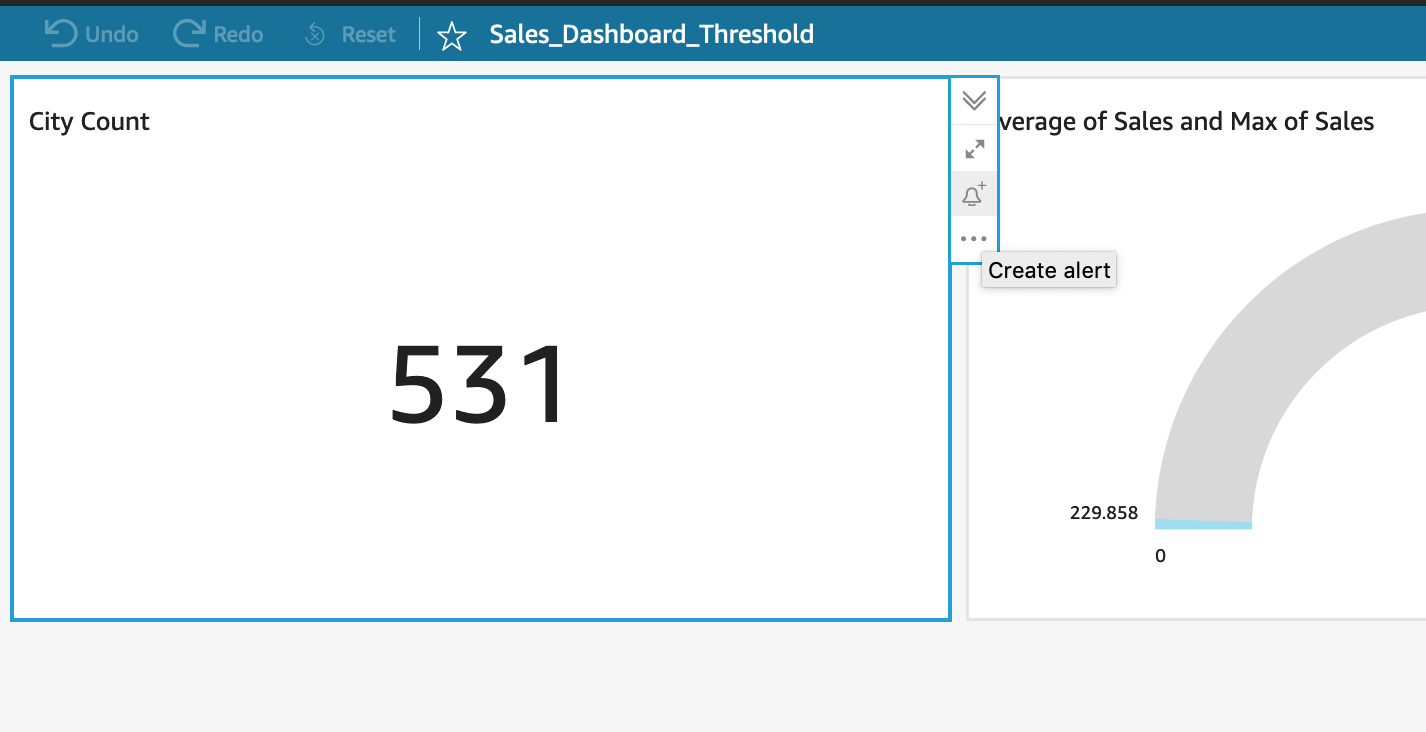\n\n4. For **Alert name**, enter a name for the alert.\n5. For **Alert value**, choose a value that you want to set the threshold for.\n\nThe values that are available for this option are based on the values the dashboard author sets in the visual. For example, let’s say you have a KPI visual that shows a percent difference between two dates. Given that, you see two alert value options: percent difference and actual.\n\nIf the visual has only one value, you can’t change this option. It’s the current value and is displayed here so that you can use it as a reference while you choose a threshold. For example, if you’re setting an alert on actual, this value shows you what the current actual cost is (for example, $5). With this reference value, you can make more informed decisions while setting your threshold.\n\n6. For **Condition**, choose a condition for the threshold\n\n\t- **Is above** – The alert triggers if the alert value goes above the threshold.\n\t- **Is below** – The alert triggers if the alert value goes below the threshold.\n\t- **Is equal** to – The alert triggers if the alert value is equal to the threshold.\n\n7. For **Threshold**, enter a value to prompt the alert.\n8. Choose **Save**.\n\n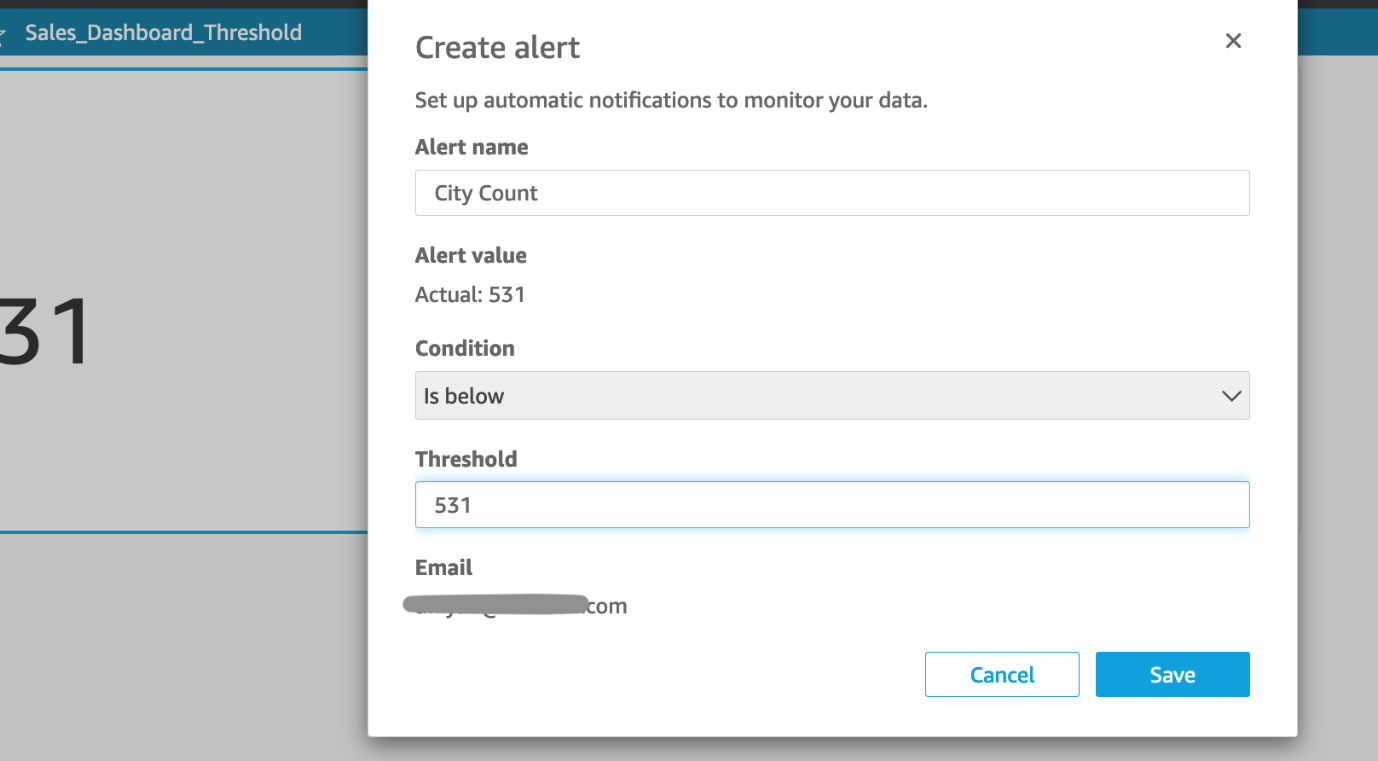\n\nA message appears indicating that the alert has been saved. If your data crosses the threshold you set, you get a notification by email at the address that’s associated with your QuickSight account.\n\n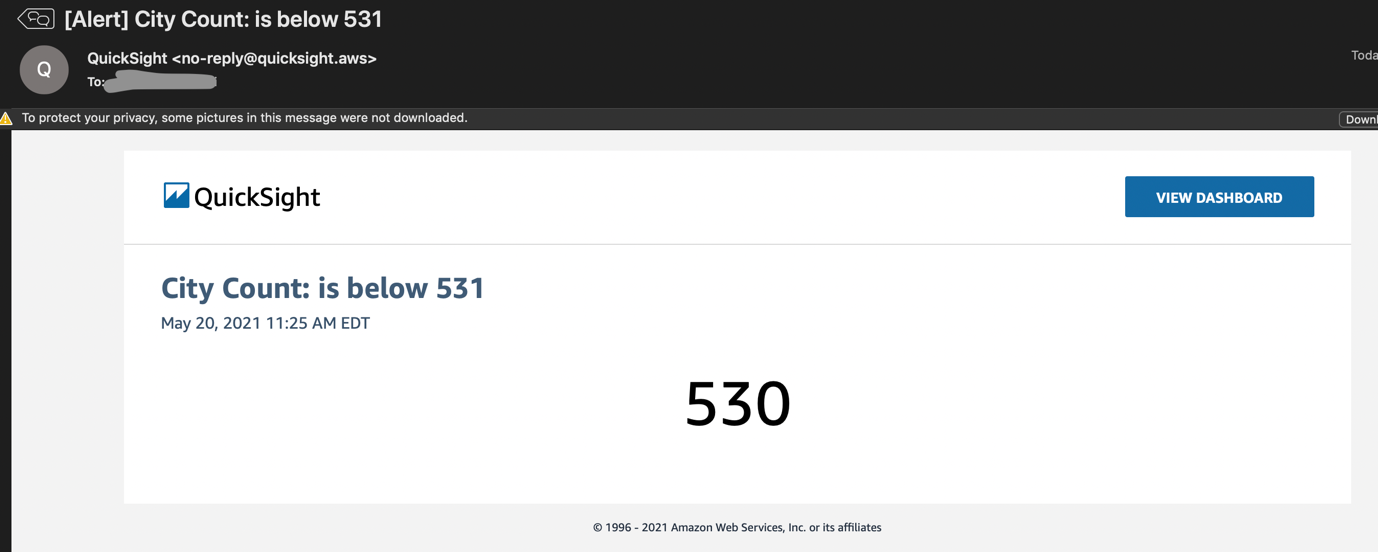\n\n\n#### **View alert history**\n\n\nTo view the history of when an alert was triggered, complete the following steps:\n\n1. On the QuickSight console, choose **Dashboards**, and navigate to the dashboard that you want to view alert history for.\n2. Choose **Alerts**.\n3. In the **Manage dashboard alerts** section, find the alert that you want to view the history for, and expand History under the alert name.\n\n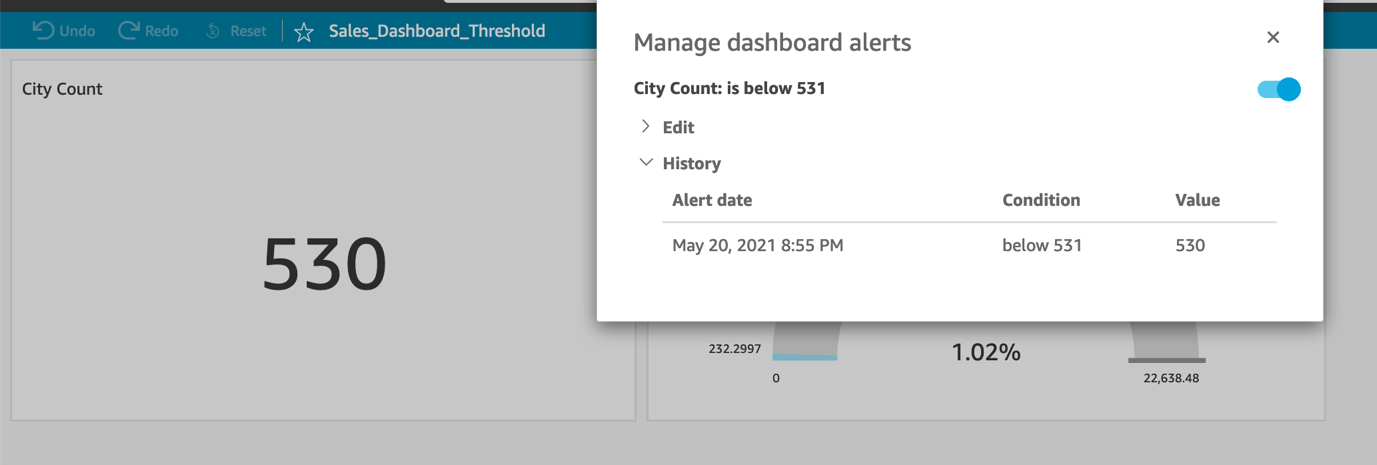\n\n\n#### **Set up email alerts if the dataset refresh fails.**\n\n\n1. On the QuickSight console, choose **Dataset**, and choose the dataset that you want to set an alert for.\n2. Select **Email owners when a refresh fails**.\n3. Close the window.\n\n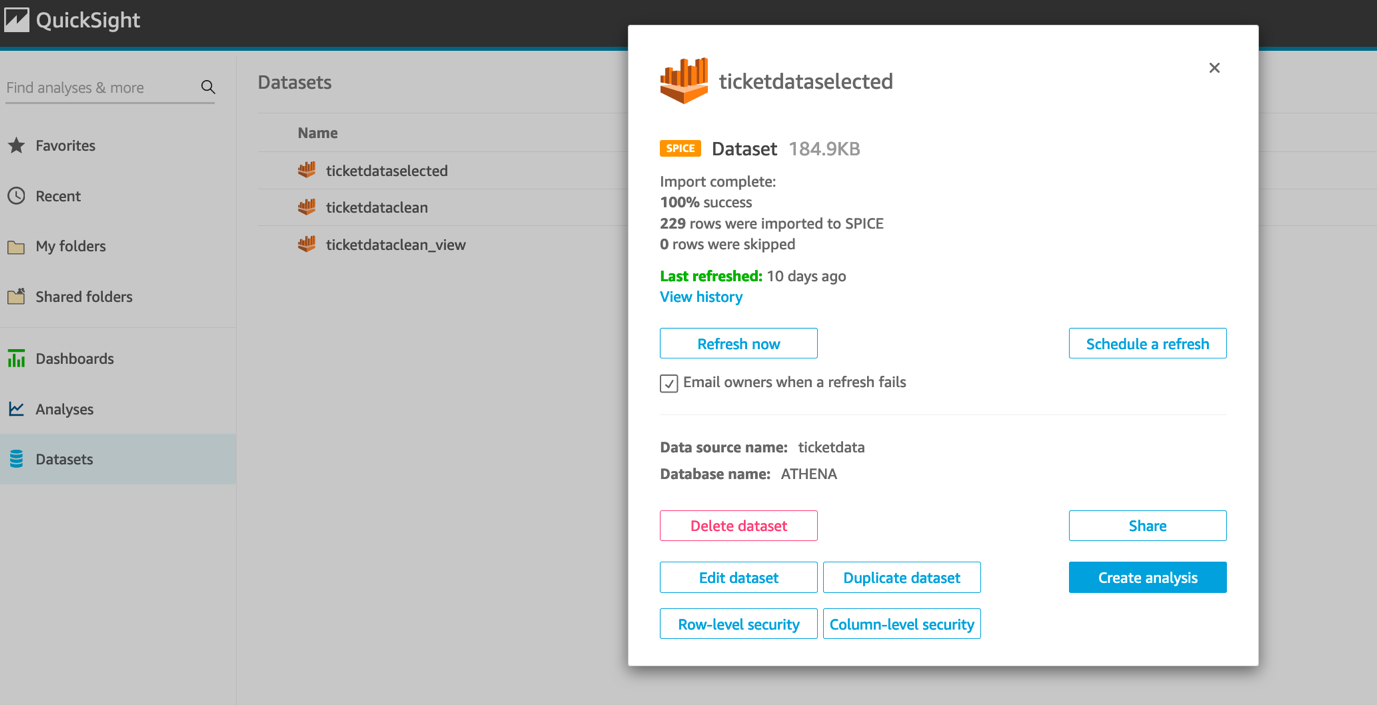\n\n\n#### **Clean up**\n\n\nTo avoid incurring future charges, delete the QuickSight users and Enterprise account.\n\n\n#### **Conclusion**\n\n\nThis post showed how to set up email scheduling of QuickSight dashboards for users and groups, as well as how end-users (readers) can configure alerts to be sent to them when a value surpasses or drops below a given threshold.\n\nYou can send dashboard snapshots as emails to groups of readers, and each reader receives custom reports as per the security configurations set on the dataset. For more information, see [sending reports by email](https://docs.aws.amazon.com/quicksight/latest/user/sending-reports.html) and [threshold alerts](https://docs.aws.amazon.com/quicksight/latest/user/threshold-alerts.html).\n\nYou can try this solution for your own use cases. If you have comments or feedback, please leave them in the comments.\n\n\n#### **About the Author**\n\n\n\n\n**Niyati Upadhyay** is a Solutions Architect at Amazon Web Services . She joined Amazon Web Services in 2019 and specializes in building and supporting big data solutions that help customers analyze and get value out of their data.","render":"<p><a href=\"https://aws.amazon.com/cn/quicksight/\" target=\"_blank\">Amazon QuickSight</a> is a cloud-scale business intelligence (BI) service that you can use to deliver easy-to-understand insights to the people you work with, wherever they are.</p>\n<p>You can build dashboards using combinations of data in the cloud, on premises, in other software as a service (SaaS) apps, and in flat files. Although users can always view and interact with dashboards on-demand in their browser or our native mobile apps, sometimes users prefer to receive notifications and report snapshots on a scheduled basis or when a certain value surpasses a user-defined threshold.</p>\n<p>In this post, we walk you through the features and process of scheduling email reports and configuring threshold-based alerts.</p>\n<h4><a id=\"Overview_of_solution_7\"></a><strong>Overview of solution</strong></h4>\n<p>In QuickSight Enterprise edition, you can email a report from each dashboard on a scheduled basis or based on a threshold set for KPI and gauge visuals. Scheduled reports include settings for when to send them, the contents to include, and who receives the email.</p>\n<p>Scheduled email reports work with row-level security so that each user receives reports containing only data that is relevant to them. Alert reports include threshold value, alert condition, and the receiver’s email. To set up or change the report sent from a dashboard, make sure that you’re an owner or co-owner of the dashboard.</p>\n<p>To receive email reports, the users or group members must be part of your QuickSight account. They must have completed the sign-up process to activate their subscription as QuickSight readers, authors, or admins.</p>\n<p>In this post, we configure the email settings for a QuickSight dashboard for users and construct a custom email for each user or group based on their data permissions.</p>\n<p>The solution includes the following high-level steps:</p>\n<ol>\n<li>Set up scheduled email alerts for your existing reports.</li>\n<li>Set up threshold-based email alerts for the existing reports.</li>\n<li>View alert history.</li>\n<li>Set up email alerts if the dataset refresh fails.</li>\n</ol>\n<h4><a id=\"Prerequisites_26\"></a><strong>Prerequisites</strong></h4>\n<p>For this walkthrough, you should have the following prerequisites:</p>\n<ul>\n<li>An <a href=\"https://signin.aws.amazon.com/signin?redirect_uri=https%3A%2F%2Fportal.aws.amazon.com%2Fbilling%2Fsignup%2Fresume&client_id=signup\" target=\"_blank\">Amazon Web Services account</a></li>\n<li>QuickSight Enterprise edition</li>\n<li>Existing QuickSight reports with appropriate data permissions and dynamic defaults that are set on dashboards that will be honored in email reports. Each reader will receive emails and PDFs of dashboards personalized to them. To learn more about dynamic defaults, refer to <a href=\"https://docs.aws.amazon.com/quicksight/latest/user/parameters-default-values.html\" target=\"_blank\">Creating parameter defaults in Amazon QuickSight</a>. You can follow the instructions in <a href=\"https://aws.amazon.com/cn/blogs/big-data/applying-row-level-and-column-level-security-on-amazon-quicksight-dashboards/\" target=\"_blank\">Applying row-level and column-level security on Amazon QuickSight dashboards</a> to develop the reports and define permissions.</li>\n</ul>\n<h4><a id=\"Set_up_scheduled_email_alerts_36\"></a><strong>Set up scheduled email alerts</strong></h4>\n<p>To configure scheduled emails for your reports, complete the following steps:</p>\n<ol>\n<li>On the QuickSight console, choose <strong>Dashboard</strong> in the navigation pane.</li>\n<li>Open a dashboard.</li>\n<li>On the <strong>Share</strong> menu, choose <strong>Email report</strong>.</li>\n</ol>\n<p><img src=\"https://dev-media.amazoncloud.cn/ec096b239e9443498ff3f9124bae3c61_image.png\" alt=\"image.png\" /></p>\n<ol start=\"4\">\n<li>For <strong>Schedule</strong>, choose the frequency for the report. For this post, we choose <strong>Repeat once a week</strong>.</li>\n</ol>\n<p><img src=\"https://dev-media.amazoncloud.cn/216d5a2b6b5045ab9d85455b0ca4fe7b_image.png\" alt=\"image.png\" /></p>\n<ol start=\"5\">\n<li>For <strong>Send first report on</strong>, choose a date and time.</li>\n<li>For <strong>Time zone</strong>, choose the time zone.</li>\n<li>For <strong>Report title</strong>, enter a custom title for the report.</li>\n<li>For <strong>(Optional) E-mail subject line</strong>, leave it blank to use the report title or enter a custom subject line.</li>\n<li>For <strong>(Optional) E-mail body text</strong>, leave it blank or enter a custom message to display at the beginning of the email.</li>\n</ol>\n<p><img src=\"https://dev-media.amazoncloud.cn/45f1fa4feb044fce8edb6059e3aecf52_image.png\" alt=\"image.png\" /></p>\n<ol start=\"10\">\n<li>Select <strong>Include PDF attachment</strong> to attach a PDF snapshot of the items visible on the first sheet of the dashboard.</li>\n<li>For <strong>Optimize report for</strong>, choose a default layout option for new users.</li>\n<li>Under <strong>Recipients</strong>, select specific recipients from the list (recommended), or select <strong>Send email report to all users with access to dashboard</strong>.</li>\n<li>To send a sample of the report before you save changes, choose <strong>Send test report</strong>.</li>\n</ol>\n<p>This option is displayed next to the user name of the dashboard owner.</p>\n<p><img src=\"https://dev-media.amazoncloud.cn/e72aab3ec1fe4efcadfc78a00dcc2303_image.png\" alt=\"image.png\" /></p>\n<ol start=\"14\">\n<li>To view a list of the datasets used by this report, choose <strong>View dataset list</strong>.</li>\n</ol>\n<p><img src=\"https://dev-media.amazoncloud.cn/80b874a444cd4f0db02ac9c083259cd5_image.png\" alt=\"image.png\" /></p>\n<ol start=\"15\">\n<li>Choose <strong>Save report</strong> or <strong>Update report</strong>.</li>\n</ol>\n<p>A “Report scheduled” message briefly appears to confirm your entries.</p>\n<ol start=\"16\">\n<li>To immediately send a report, choose <strong>Update & send a report now</strong>.</li>\n</ol>\n<p>The report is sent immediately, even if your schedule’s start date is in the future.</p>\n<p><img src=\"https://dev-media.amazoncloud.cn/4f1bde4751a14733be3cac3bcc77515f_image.png\" alt=\"image.png\" /></p>\n<p>The following screenshot shows the PDF report visible to the user <code>AlejandroRosalez</code>. They have access to data where the state is California or Texas, and the city is Los Angeles or Fort Worth.</p>\n<p><img src=\"https://dev-media.amazoncloud.cn/0261703ad2e7472c80b2b8f6395a7a8a_image.png\" alt=\"image.png\" /></p>\n<p>The following screenshot shows the report visible to the user <code>SaanviSarkar</code>. They can see data for any city, but only if the state is Texas.</p>\n<p><img src=\"https://dev-media.amazoncloud.cn/ed065fa5c3ca47d7ad0dcd5d6e95a07c_image.png\" alt=\"image.png\" /></p>\n<p>The following screenshot shows the report visible to the user <code>MarthaRivera</code>. Martha can see the data for any city or state.</p>\n<p><img src=\"https://dev-media.amazoncloud.cn/f0662d5b827847778490de7781fee004_image.png\" alt=\"image.png\" /></p>\n<p>The following screenshot shows that no data is visible to the <code>workshop</code> user, which isn’t present in the <code>permissions.csv</code> file.</p>\n<p><img src=\"https://dev-media.amazoncloud.cn/da0435be38364567a8410ded30945e76_image.png\" alt=\"image.png\" /></p>\n<h4><a id=\"Set_up_thresholdbased_email_alerts_99\"></a><strong>Set up threshold-based email alerts</strong></h4>\n<p>To create an alert based on a threshold, complete the following steps:</p>\n<ol>\n<li>On the QuickSight dashboard, choose <strong>Dashboards</strong>, and navigate to the dashboard that you want.</li>\n</ol>\n<p>For more information about viewing dashboards as a dashboard subscriber in QuickSight, see <a href=\"https://docs.aws.amazon.com/quicksight/latest/user/exploring-dashboards.html\" target=\"_blank\">Exploring Dashboards</a>.</p>\n<ol start=\"2\">\n<li>In the dashboard, select the KPI or gauge visual that you want to create an alert for.</li>\n<li>On the options menu at upper-right on the visual, choose the <strong>Create alert</strong> icon.</li>\n</ol>\n<p><img src=\"https://dev-media.amazoncloud.cn/da5df306aa58420abe7cd24dd32c042b_image.png\" alt=\"image.png\" /></p>\n<ol start=\"4\">\n<li>For <strong>Alert name</strong>, enter a name for the alert.</li>\n<li>For <strong>Alert value</strong>, choose a value that you want to set the threshold for.</li>\n</ol>\n<p>The values that are available for this option are based on the values the dashboard author sets in the visual. For example, let’s say you have a KPI visual that shows a percent difference between two dates. Given that, you see two alert value options: percent difference and actual.</p>\n<p>If the visual has only one value, you can’t change this option. It’s the current value and is displayed here so that you can use it as a reference while you choose a threshold. For example, if you’re setting an alert on actual, this value shows you what the current actual cost is (for example, $5). With this reference value, you can make more informed decisions while setting your threshold.</p>\n<ol start=\"6\">\n<li>\n<p>For <strong>Condition</strong>, choose a condition for the threshold</p>\n<ul>\n<li><strong>Is above</strong> – The alert triggers if the alert value goes above the threshold.</li>\n<li><strong>Is below</strong> – The alert triggers if the alert value goes below the threshold.</li>\n<li><strong>Is equal</strong> to – The alert triggers if the alert value is equal to the threshold.</li>\n</ul>\n</li>\n<li>\n<p>For <strong>Threshold</strong>, enter a value to prompt the alert.</p>\n</li>\n<li>\n<p>Choose <strong>Save</strong>.</p>\n</li>\n</ol>\n<p><img src=\"https://dev-media.amazoncloud.cn/4439f9821865450fb7c2b4e68c3370ff_image.png\" alt=\"image.png\" /></p>\n<p>A message appears indicating that the alert has been saved. If your data crosses the threshold you set, you get a notification by email at the address that’s associated with your QuickSight account.</p>\n<p><img src=\"https://dev-media.amazoncloud.cn/d977dd8bca574b96a02b660ebc05e994_image.png\" alt=\"image.png\" /></p>\n<h4><a id=\"View_alert_history_136\"></a><strong>View alert history</strong></h4>\n<p>To view the history of when an alert was triggered, complete the following steps:</p>\n<ol>\n<li>On the QuickSight console, choose <strong>Dashboards</strong>, and navigate to the dashboard that you want to view alert history for.</li>\n<li>Choose <strong>Alerts</strong>.</li>\n<li>In the <strong>Manage dashboard alerts</strong> section, find the alert that you want to view the history for, and expand History under the alert name.</li>\n</ol>\n<p><img src=\"https://dev-media.amazoncloud.cn/232ce0df2e2d41849cacca0a1f50bd3a_image.png\" alt=\"image.png\" /></p>\n<h4><a id=\"Set_up_email_alerts_if_the_dataset_refresh_fails_148\"></a><strong>Set up email alerts if the dataset refresh fails.</strong></h4>\n<ol>\n<li>On the QuickSight console, choose <strong>Dataset</strong>, and choose the dataset that you want to set an alert for.</li>\n<li>Select <strong>Email owners when a refresh fails</strong>.</li>\n<li>Close the window.</li>\n</ol>\n<p><img src=\"https://dev-media.amazoncloud.cn/793ac6d332b94610b90b368e3677d429_image.png\" alt=\"image.png\" /></p>\n<h4><a id=\"Clean_up_158\"></a><strong>Clean up</strong></h4>\n<p>To avoid incurring future charges, delete the QuickSight users and Enterprise account.</p>\n<h4><a id=\"Conclusion_164\"></a><strong>Conclusion</strong></h4>\n<p>This post showed how to set up email scheduling of QuickSight dashboards for users and groups, as well as how end-users (readers) can configure alerts to be sent to them when a value surpasses or drops below a given threshold.</p>\n<p>You can send dashboard snapshots as emails to groups of readers, and each reader receives custom reports as per the security configurations set on the dataset. For more information, see <a href=\"https://docs.aws.amazon.com/quicksight/latest/user/sending-reports.html\" target=\"_blank\">sending reports by email</a> and <a href=\"https://docs.aws.amazon.com/quicksight/latest/user/threshold-alerts.html\" target=\"_blank\">threshold alerts</a>.</p>\n<p>You can try this solution for your own use cases. If you have comments or feedback, please leave them in the comments.</p>\n<h4><a id=\"About_the_Author_174\"></a><strong>About the Author</strong></h4>\n<p><img src=\"https://dev-media.amazoncloud.cn/56dd8b23184f4744b4e6ea89ec691b57_image.png\" alt=\"image.png\" /></p>\n<p><strong>Niyati Upadhyay</strong> is a Solutions Architect at Amazon Web Services . She joined Amazon Web Services in 2019 and specializes in building and supporting big data solutions that help customers analyze and get value out of their data.</p>\n"}
Schedule email reports and configure threshold based-email alerts using Amazon QuickSight
海外精选

海外精选的内容汇集了全球优质的亚马逊云科技相关技术内容。同时,内容中提到的“AWS”
是 “Amazon Web Services” 的缩写,在此网站不作为商标展示。

 0
0 0
0亚马逊云科技解决方案 基于行业客户应用场景及技术领域的解决方案
联系亚马逊云科技专家
亚马逊云科技解决方案
基于行业客户应用场景及技术领域的解决方案
联系专家

0
目录

 分享
分享 点赞
点赞 收藏
收藏 目录
目录立即注册,开启您的免费套餐
立即关注

亚马逊云开发者
公众号

User Group
公众号

亚马逊云科技
官方小程序
“AWS” 是 “Amazon Web Services” 的缩写,在此网站不作为商标展示。
立即关注
亚马逊云开发者
公众号
User Group
公众号
亚马逊云科技
官方小程序
“AWS” 是 “Amazon Web Services” 的缩写,在此网站不作为商标展示。
关于我们 
更多资源
开发者工具
更多支持
立即关注
亚马逊云开发者
公众号
User Group
公众号
亚马逊云科技
官方小程序
“AWS” 是 “Amazon Web Services” 的缩写,在此网站不作为商标展示。
